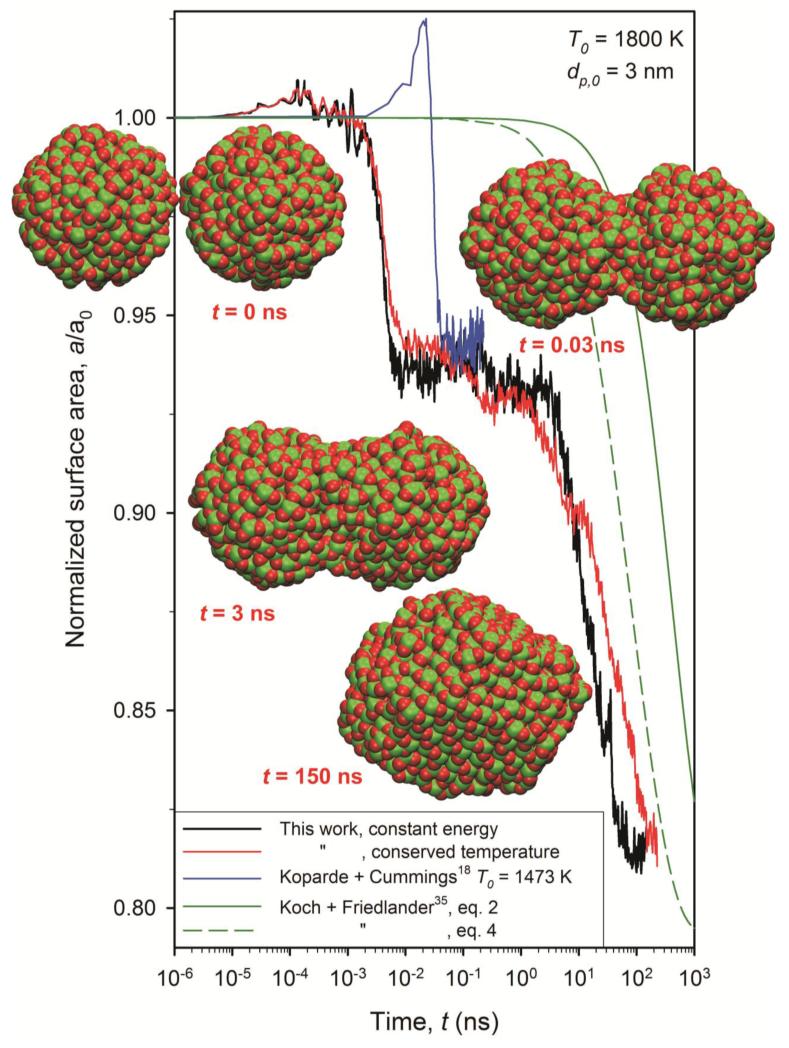
Figure 1.
Evolution of normalized surface area of two sintering TiO2 nanoparticles (dp,0 = 3 nm) by MD for constant energy (black line) and conserved temperature (red line) integration at T0 = 1800 K along with the MD simulations18 at 1473 K (blue line, constant energy) and the predictions of a phenomenological model35 with characteristic sintering times from equation 2 (green solid line) by Kobata et al.21 and equation 4 (green broken line) developed here.

