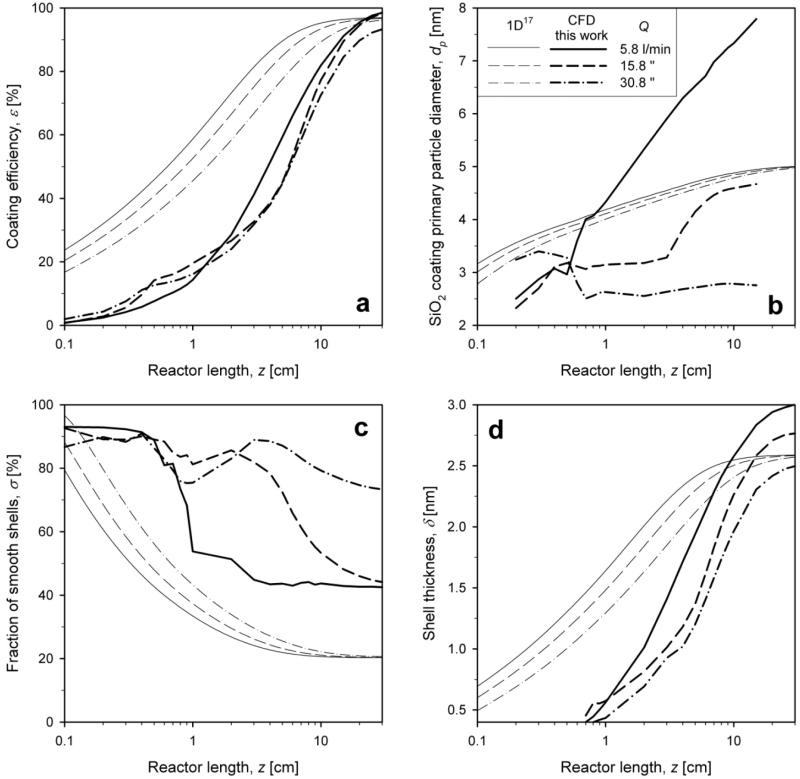
Figure 8.
Evolution of a) coating efficiency and mixing-cup averages of b) coating primary particle (SiO2) diameter, c) fraction of smooth shells and d) shell thickness as function of reactor length from the 1D (thin lines)17 and CFD (bold lines, this work) coating models for total HMDSO/N2 flow rate of Q = 5.8 (solid line), 15.8 (dashed line) and 30.8 l/min (dash-dot line) for WF = 20 wt%.

