
Figure 4.
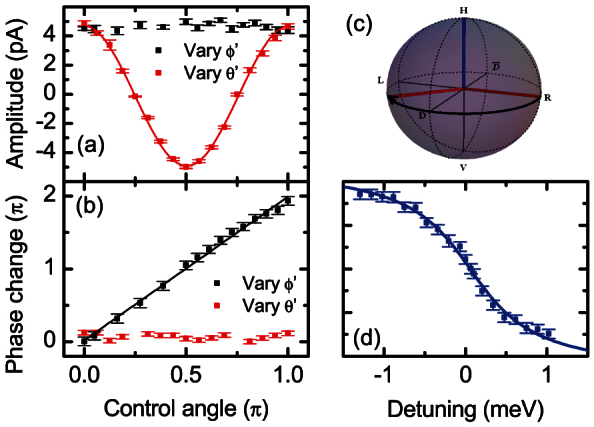
(a–b) Quantitative analysis of the data presented in figure 3(c–d): (a) Amplitudes and (b) phase change as a function of the control pulse angles ϕ′ (θ′) in black (red). (c–d) Effect of varying the control pulse detuning for the configuration illustrated in (c).