Figure 5.

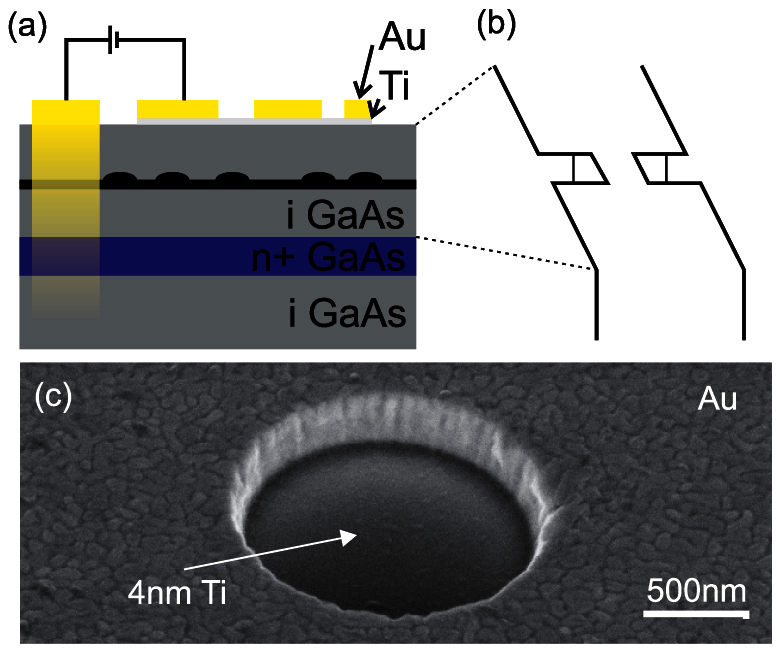
(a–b)Schematic illustration of the sample structure (a) and resulting band structure (b).(c) Scanning electron microscopy image of an aperture.

(a–b)Schematic illustration of the sample structure (a) and resulting band structure (b).(c) Scanning electron microscopy image of an aperture.