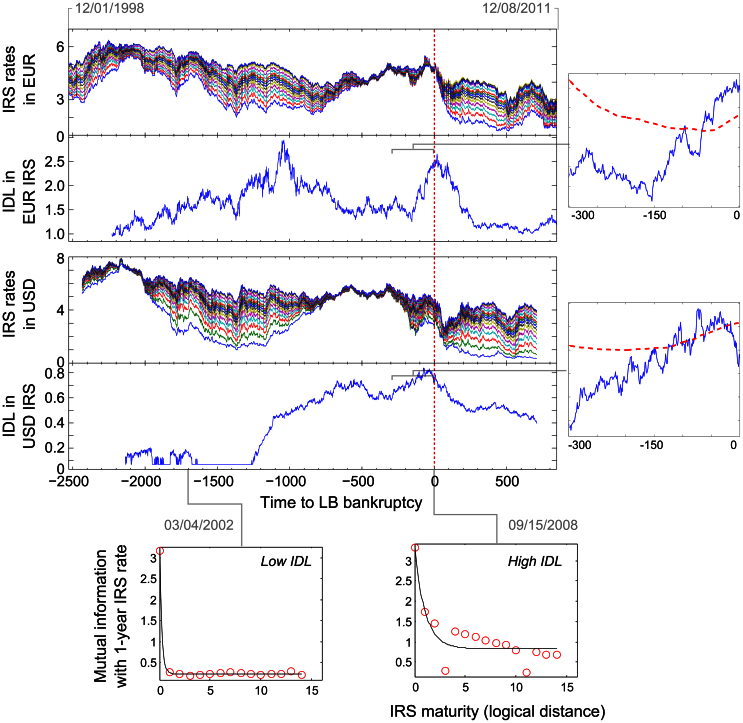
Figure 1. The original time series of the IRS rates for different maturities and the corresponding IDL indicators for the EUR and USD markets.
The IDL at time t is calculated using the 300 most recent returns up to time t. Inset: the IDL indicator and a warning threshold during the 300 trade days preceding the LB bankruptcy. We set the warning threshold at two times standard deviations above the mean IDL of a sliding window of 750 trade days. Bottom: the mutual information between the rates of the 1-year maturity IRS and all other maturities (red circles) at two different trade days. The fitted exponential decay is used to estimate the IDL of the IRS rates across maturities for that specific trade day.

