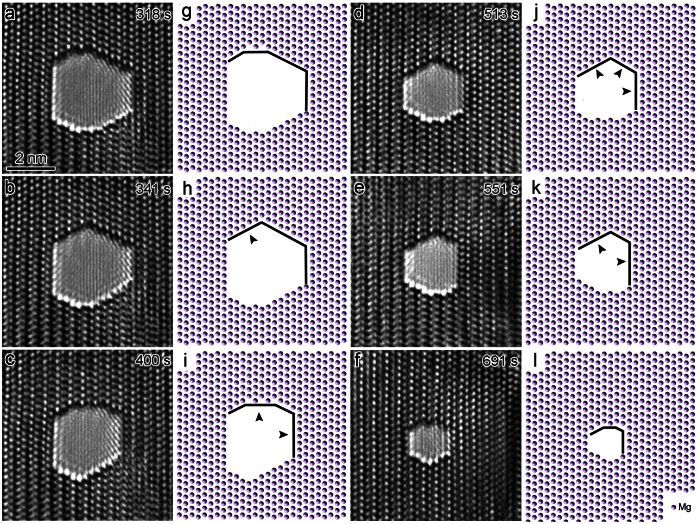
Figure 3. The healing process of an individual nanopore.
(a–f) Sequential HRTEM images showing the alteration of nanopore morphology during continuous e-beam irradiation at a constant intensity and focus setting. (g–l) Schematic illustration corresponding to (a–f), respectively. The arrow heads point to newly nucleated layers compared to previous images.

