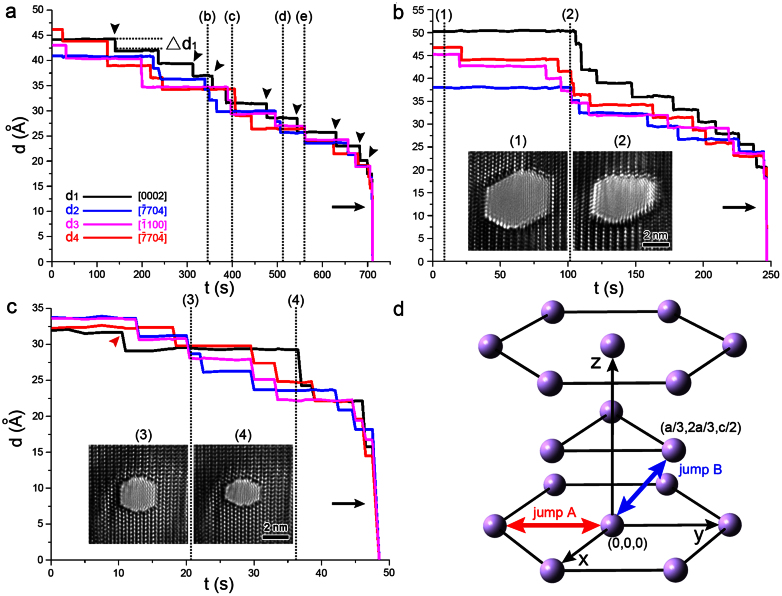
Figure 4. Anisotropic surface diffusion procedure.
(a) A plot of the pore width versus e-beam irradiation time of the nanopore shown in Fig. 3. The nanopore morphology at the moment marked as (b), (c), (d), and (e) is shown in Figs. 3b–3e, respectively. The black arrow heads point to the moment before new (0002) layers nucleated. (b–c) Width-time curves of two typical nanopores with original sizes of 4.5 and 3.3 nm. The insets (1)–(4) correspond to the nanopore morphology at the moment marked as (1)–(4), respectively. The width along the [0002],  ,
,  , and
, and  directions is represented by black, blue, pink, and red lines, respectively. The arrows point to the observed decrease in width before the nanopore closed. (d) A schematic illustration of two independent jumps in an HCP crystal.

