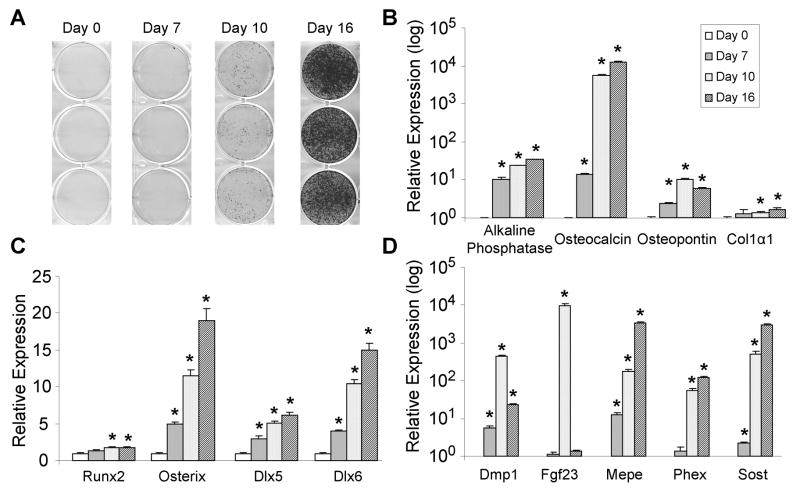
Fig. 1.
Bone-marker and osteocytic gene expression during differentiation of primary mouse calvarial osteoblasts. (A) Osteoblastic differentiation of primary mouse calvarial osteoblasts was induced at confluence and mineralization was determined by Alizarin red stain at the indicated timepoints. QPCR analyses of genes involved in, (B) forming the extracellular bone matrix, (C) osteoblastic transcriptional regulation, and (D) osteocyte biology were performed from samples harvested at the indicated timepoints (n=4). The bars represent fold-induction relative to the expression at day 0 for each gene. The data are presented as the mean ± SE and an asterisk (*) represents statistical significance of p ≤ 0.01 (Student’s t-test).

