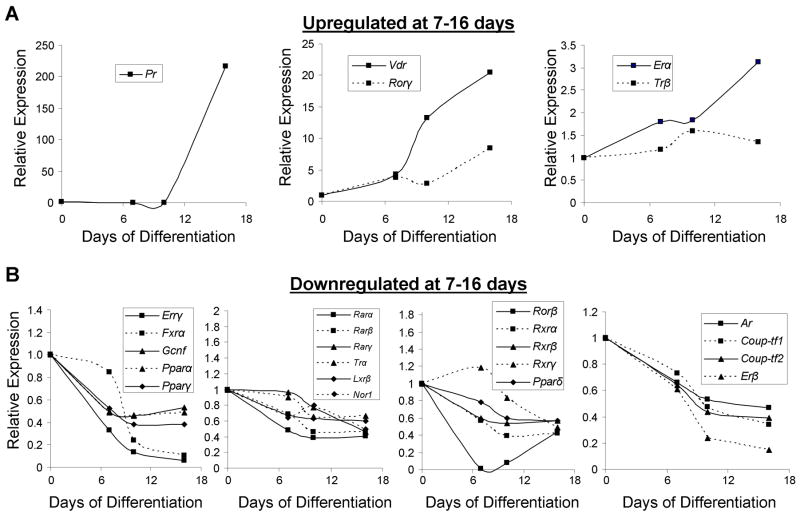
Fig. 3.
Expression of NRs late in osteoblastic differentiation. Osteoblastic differentiation of primary mouse calvarial osteoblasts was induced at confluence and harvested at 0, 7, 10 and 16 days (n=4) and QPCR performed as in Fig. 2. The genes were grouped by their expression characteristics; (A) upregulated at 7–16 days or (B) downregulated at 7–16 days. Figure legends within each graph describe the graph labels. Strictly for figure clarity, SEs and p-values have been omitted but the data conform to the above statistical standards (≥ 1.5-fold threshold and p ≤ 0.05, at least at one timepoint).

