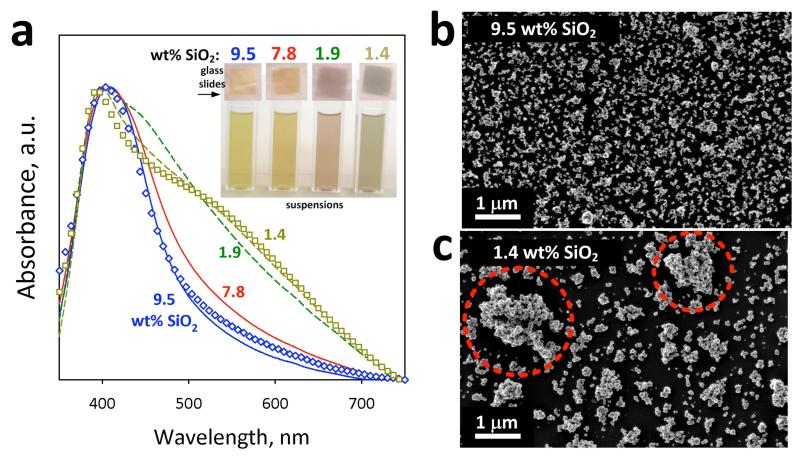
Figure 6.
(a) The optical absorption spectra of deposited nanosilver particles on glass slides. In the inset, pictures of the dispersed nanosilver in aqueous suspensions and on glass slides are shown. Partially-coated nanosilver particles (1.4 and 1.9 wt% SiO2) form agglomerates which broaden the plasmon absorption band (broken lines). The SiO2 layer, however, surrounding the fully-coated nanosilver particles (7.8 and 9.5 wt% SiO2) prevents their agglomeration or flocculation and narrows their plasmon absorption band (solid lines). This occurs in the suspensions, since their spectra are identical to the ones from the glass slides (symbols). SEM images of the (b) fully-coated (9.5 wt%) and (c) partially-coated (1.4 wt% SiO2) nanosilver verifying the absorption spectra. The partially-coated nanosilver results in bigger agglomerated or flocculated structures (highlighted in red circles) in suspensions.

