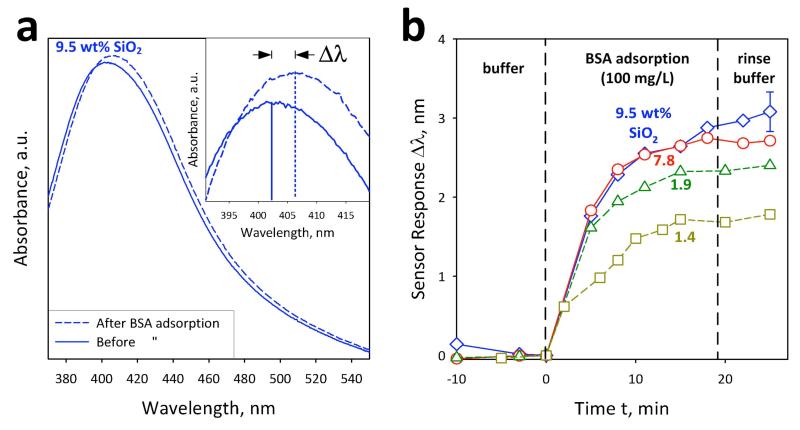
Figure 7.
(a) The optical absorption spectra before (solid line) and after (broken line) adsorption of bovine serum albumin (BSA, 100 mg L−1). The inset shows the shift of the peak position Δλ which corresponds to the sensor response. (b) The sensor response Δλ as a function of time for the fully-coated (circles, diamonds) and partially-coated (squares, triangles) nanosilver. The fully-coated nanosilver outperforms the partially-coated one, because of the less agglomeration of the former (Figures 6b,c).

