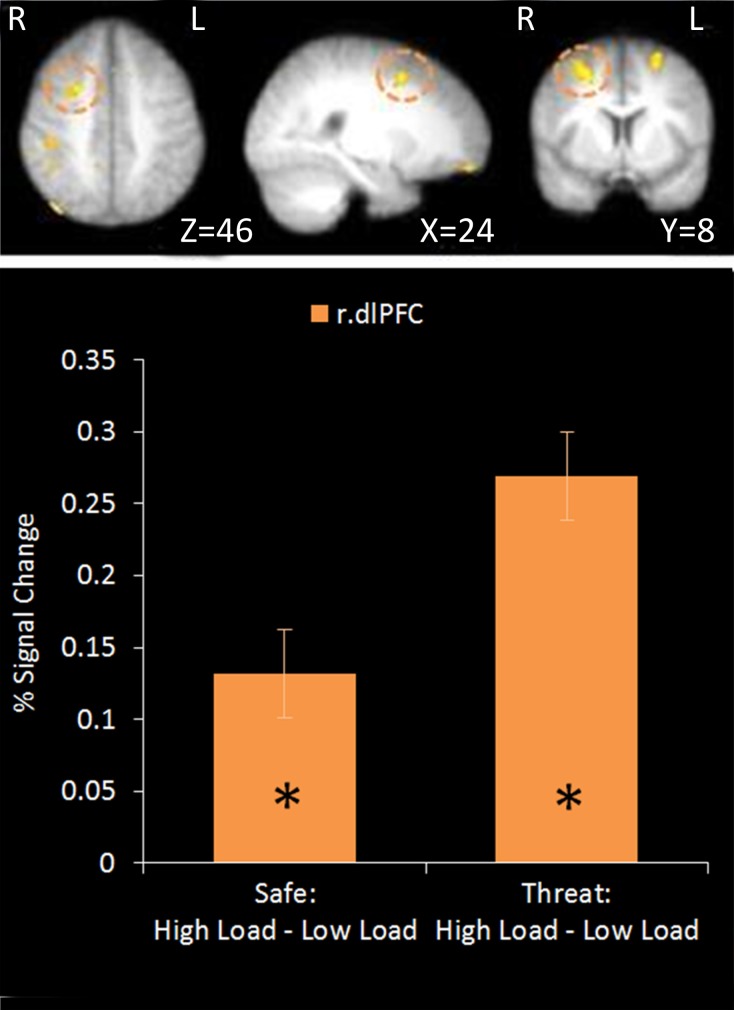
Figure 3.
Top: High Load—Low Load contrast imaging results. Threshold of z = 2.3 uncorrected. Bottom: A right dorsolateral cluster displayed greater activation under High Load compared to Low Load in both Safe and Threat trials [High Load/Safe—Low Load/Safe: mean difference = 0.121%, S.D = 0.178, t(17) = 2.880, p = 0.010; High Load/Threat—Low Load/Threat: mean difference = 0.162%, S.D = 0.188, t(17) = 3.656, p = 0.002]. Error bars display within-subject standard error (Morey, 2008). *p < 0.05 (two-tailed).

