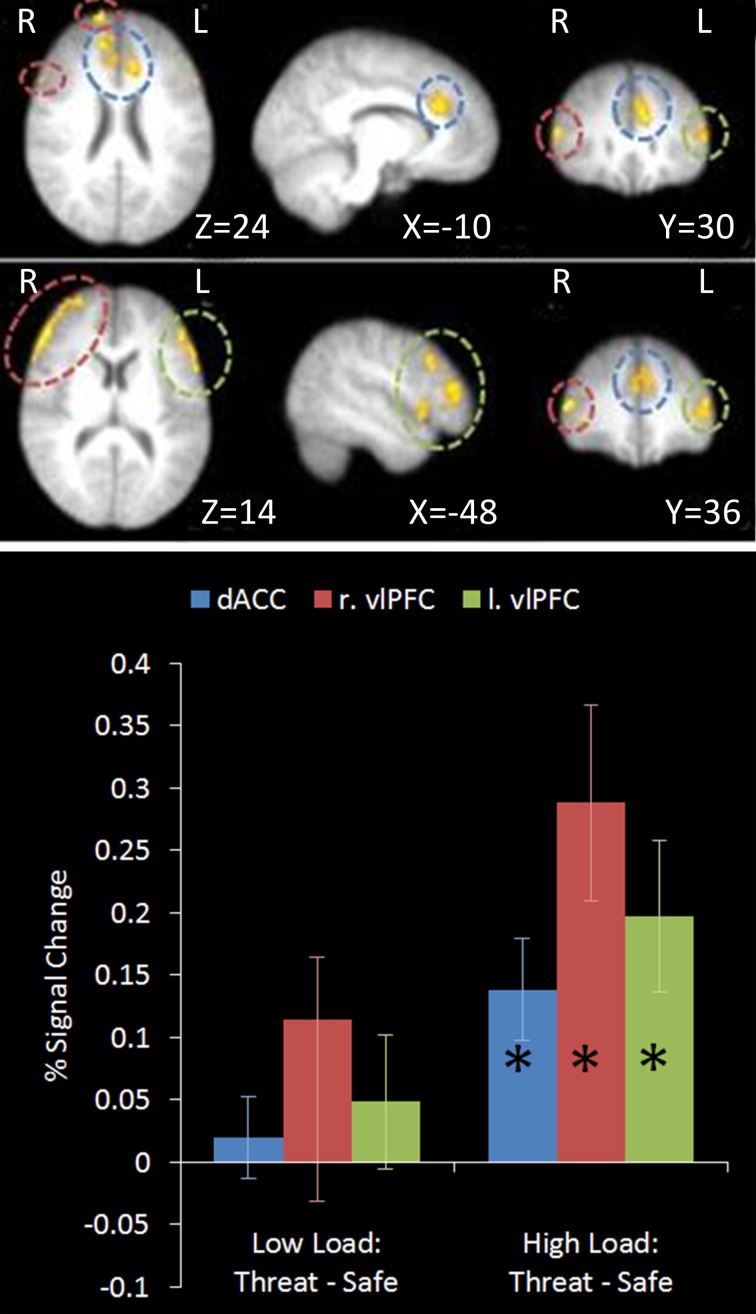
Figure 5.
Top: Top-down control contrast imaging results. This contrast revealed areas where activation was greater under High Load/Threat conditions compared to all others. Three clusters were identified: Dorsal ACC as well as bilateral PFC. Medial (upper panel) and lateral (lower panel) views are displayed. Bottom: Pairwise comparisons of the signal change in the regions identified. Activation in all three clusters was greater under threat compared to safety under the equivalent working memory loads, however this increase was only significant under High Load [cingulate: High Load/Threat—High Load/Safe: mean difference = 0.139%, S.D = 0.122, t(17) = 4.838, p < 0.001; left vlPFC: High Load/Threat—High Load/Safe: mean difference = 0.197%, S.D = 0.181, t(17) = 4.614, p < 0.001; right vlPFC: High Load/Threat—High Load/Safe: mean difference = 0.288%, S.D = 0.236, t(17) = 5.176, p < 0.001]. Error bars display within-subject standard error (Morey, 2008). *p < 0.05 (two-tailed).

