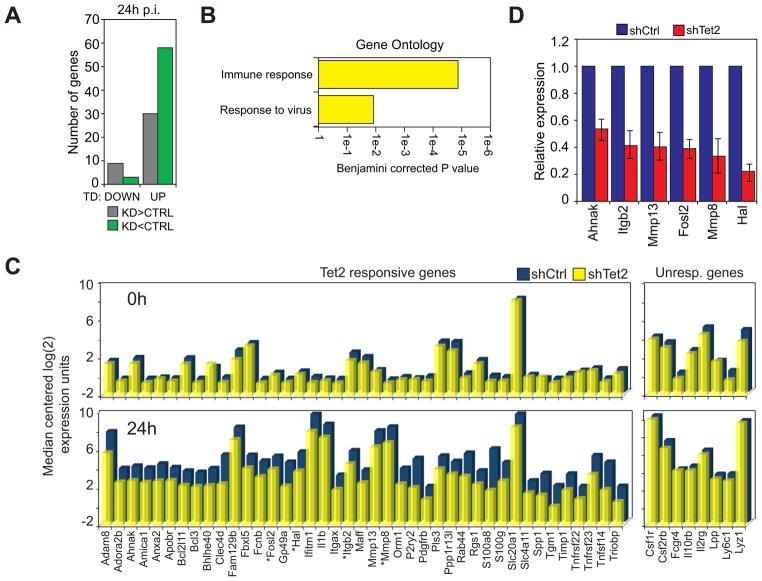
Figure 3. Disruption of Tet2 impairs the upregulation of myeloid specific genes. See also Figure S2.
A) Number of genes that are downregulated (DOWN) or upregulated (UP) during transdifferentiation and misexpressed at least 1.5 fold in Tet2 kd cells versus the control. Misexpressed genes are further subdivided into those that are expressed at higher levels in Tet2 kd cells (KD>CTRL, grey) and those that are expressed at lower levels in Tet2 kd cells (KD<CTRL, green).
B) Top Biological Process ontology terms associated with genes upregulated during transdifferentiation and expressed lower in Tet2 kd cells when compared to controls. X-axis represents the Benjamini-corrected P value of ontology term enrichment.
C) Bar plot of genes from the microarray that show a decreased expression upon Tet2 kd (Tet2 responsive genes) compared to selected genes not affected by Tet2 kd (Unresponsive genes). Median centered expression values are presented for the indicated gene (x-axis) in uninduced (0h) and 24h induced control cells (shCtrl, blue bars) and Tet2 knockdown cells (shTet2, yellow bars). Asterisks denote verified direct Tet2 target genes.
D) qRT-PCR validation of several genes identified by microarray at 24h p.i.. Samples were normalized against Hprt and expression in Tet2 kd cells (shTet2, red bars) was set relative to that in control cells (shCtrl, blue bars). Data are presented as the mean ±SD of three biological replicates.

