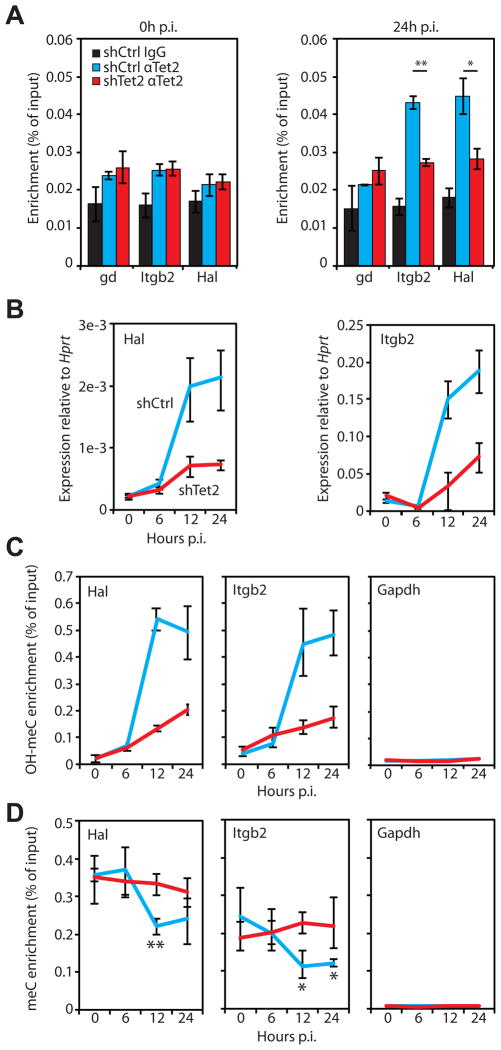
Figure 4. Tet2 binding to the promoters of selected genes results in OH-MeC accumulation. See also Figure S3.
A) Tet2 binding at target gene promoters in 0h and 24h p.i. cells was analyzed by chromatin immunoprecipitation (ChIP) followed by qPCR. The experiment was carried out in control (shCtrl, blue bars) and Tet2 kd (shTet2, red bars) cells. Local background was determined through IgG experiments carried out in shCtrl samples (IgG, black bars). Data presented as mean percentage of input ±SD of three biological replicates. Student’s t-test P value between shCtrl and shTet2 replicates < 0.01 (*), < 0.001 (**). Gene desert region, gd.
B) qRT-PCR analysis of Hal (left panel) and Itgb2 (right panel) gene expression in control (shCtrl, blue lines) and Tet2 kd (shTet2, red lines) cells induced to transdifferentiate for the time indicated on the x-axis. Data presented as mean expression relative to Hprt ±SD of three biological replicates.
C) Hydroxymethyl-DIP (αOH-MeC) assays followed by qPCR were performed at the indicated gene promoters (Hal, Itgb2, Gapdh) in control and Tet2 kd (colored as in B) cells at 0, 6, 12, and 24h p.i. of transdifferentiation. Data presented as in A.
D) Methyl-DIP (αMeC) assays followed by qPCR were performed at the indicated gene promoters (Hal, Itgb2, Gapdh) in control and Tet2 kd (colored as in B) cells at 0, 6, 12, and 24h p.i. of transdifferentiation. Data presented as in A. Asterisks indicate Student’s t-test P value between 0h and the indicated time in shCtrl cells < 0.05 (*), < 0.01 (**).

