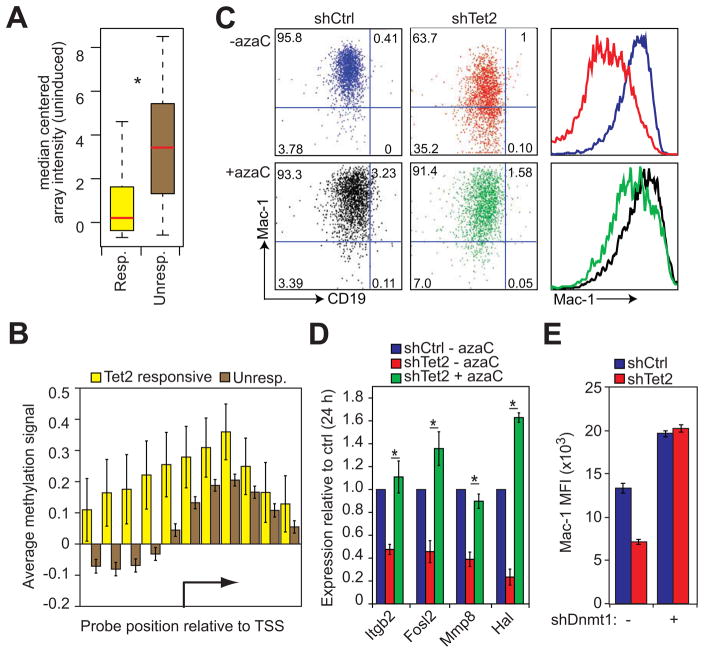
Figure 5. DNA methylation contributes to Tet2 target gene silencing. See also Figure S4.
A) Box plot representation of median-centered gene expression (log2 expression units) in uninduced control cells for genes that are upregulated during normal transdifferentiation and either respond to Tet2 kd (Resp., yellow, n=58) or do not respond to kd (Unresp., brown, n=1447). Red line indicates the median expression value of each cohort. Asterisk denotes Kolmogorov-Smirnov test P=1.029e-12.
B) Bar plot of average DNA methylation at the transcription start sites (TSS) of Tet2 responsive (yellow bars, n=58) and unresponsive genes (brown bars, n=1182) as determined by MethylCAP-chip assay. Data are presented as the mean normalized signal from a methyl-DNA binding domain pull down assay hybridized to promoter tiling arrays. Error bars represent ±SD between aligned probes within a given group.
C) FACS plots of 48h p.i. pre-B cell to macrophage transdifferentiation of control (shCtrl) and Tet2 kd (shTet2) cells carried out with or without treatment with 5-azacytidine (+azaC, -azaC). Quadrant gates are set with respect to uninduced control cells. Mac-1 histogram plots (right panels) colored with respect to FACS plots. Data presented are representative of three biological replicates.
D) qRT-PCR analysis of Tet2 target genes 24h p.i. in control cells (shCtrl – azaC, blue) and Tet2 kd cells with or without 5-azacytidine pretreatment (shTet2 + azaC, green; shTet2 – azaC, red). Data represented as mean ±SD of Hprt normalized expression set relative to shCtrl levels of three biological replicates. Asterisks indicate Student’s t-test P value < 0.05 between shTet2 kd +/− azaC.
E) Bar plots of Mac-1 expression in control (shCtrl, blue bars) and Tet2 knockdown (shTet2, red bars) cells superinfected or not with a lentivirus containing an shDnmt1 knockdown construct. Data presented as mean ±SD of three biological replicates. Representative FACS plots are presented in Figure S4C.

