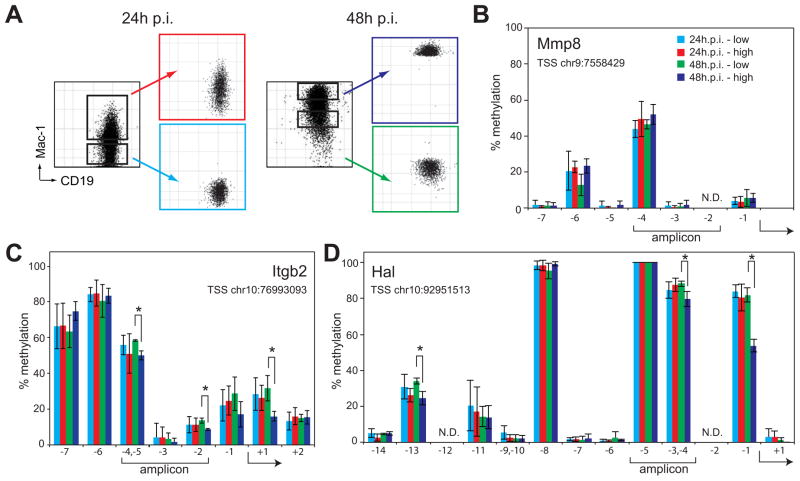
Figure 6. Cytosines within selected Tet2 target gene promoters may become demethylated after induced transdifferentiation.
A) FACS plots of C10 cells induced for 24 or 48h prior and after sorting into Mac-1 low and Mac-1 high populations.
B–D) Percentage of individual modified cytosines at the Mmp8 (B), Itgb2 (C) and Hal (D) promoters as determined by Sequenom MassARRAY analysis at the indicated positions. X-axis depicts the position of analyzed cytosines with respect to the TSS of the gene and y-axis the percentage of methylation. Data represent mean ±SD of three biological replicates. Asterisks, Student’s t-test P value < 0.05 between Mac-1 high and Mac-1 low populations 48h p.i.; Brackets below the x-axis, position of the qPCR amplicons used for DNA immunoprecipitation and ChIP experiments in Fig. 4. The genomic coordinate of each TSS is given in the graph and the arrow indicates the relative location within the individual CpGs analyzed. CpGs that could not be analyzed, N.D. Color corresponds to the FACS plots shown in A. Chromosome position of the assayed region: Mmp8, chr9:7557999-7558511; Itgb2, chr10:76992548-76993258; Hal, chr10:92950958-92951420. Position data is relative to mouse genome build mm9.

