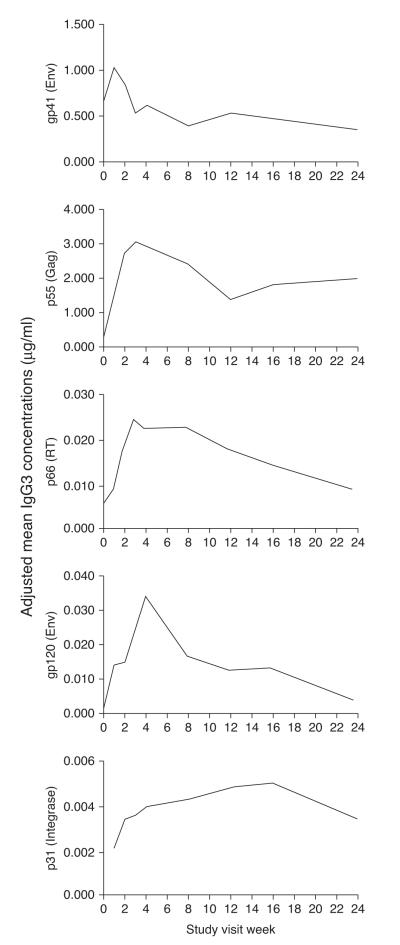
Fig. 1.
HIV-specific IgG3 antibody responses peak sequentially during acute HIV-1 infection. Mean concentrations of HIV-specific IgG3 are shown in a longitudinal model in which responses were aligned to study enrollment and adjusted for time after HIV-1 acquisition according to the classification by Fiebig et al. [22].

