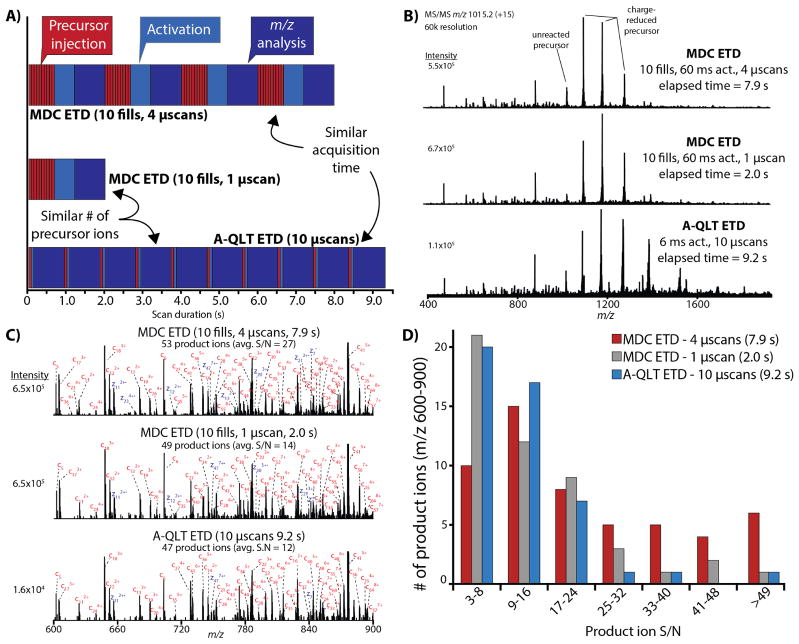
Figure 2.
Comparison of A-QLT and MDC ETD for Histone H3.3. (A) The major scan events contributing to the MS/MS duty cycle for conducting ETD in the MDC using multiple fills and ion trap ETD for histone infusion. The major scan events are divided into precursor injection (5×10⁵ AGC target), precursor activation by ETD, and Orbitrap product ion analysis (60k resolution, 768 ms transient). (B) MS/MS spectra of histone H3.3 (+15, m/z 1015.2, 60k resolving power) analyzed using MDC ETD with 10 fills and 4 microscans (top), MDC ETD with 10 fills and 1 microscan (middle), and A-QLT ETD using 10 microscans. Reaction completeness for each ETD reaction was determined from the relative ratios of charge-reduced precursors to the unreacted precursor. A comparison of the top and bottom spectra represent similar acquisition times (7.9 s and 9.2 s), while a comparison of the middle and bottom spectra represent the same total number of precursors analyzed during the course of acquisition (~ 5×10⁶ charges). (C) Annotated portion of the histone H3.3 spectra. A product ion was considered a match if the S/N was > 3 and with a mass error less than 10 ppm. (D) Distribution of product ion S/N from (A).

