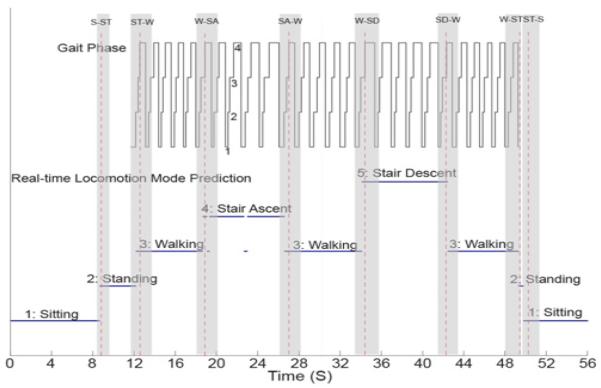
Fig. 4.
Real-time system performance in one representative testing trial. The white area denotes the static states period (level walking, stair ascent, stair descent, sitting, and standing); the gray area represents the transitional period. The red dash line indicates the critical timing for each transition.

