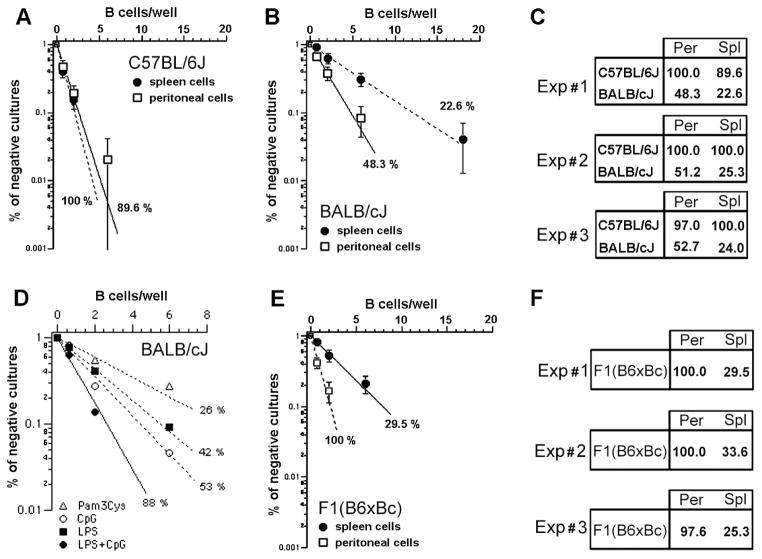
FIGURE 2. Genetic control of LPS response in B cells from spleen or peritoneal cavity.
Splenic or peritoneal cavity B cells were cultivated under limiting dilution conditions in the presence of LPS, 30μg/mL, using S17 stroma cell line as feeder cells. The percentage of negative cultures is plotted against the B cell number/well, and frequencies of responding cells were calculated according to Poisson’s distribution. The results from three independent experiments comparing the frequencies of response to LPS of peritoneal and splenic B cells from (A) C57BL/6J and (B) BALB/c mice are shown in (C). Shown in (D) are the frequencies of response to different combinations of TLR ligands by sorted B1a cells. In (E), the frequencies of response to LPS of PEC and splenic B cells from F1 mice are depicted. (F) shows the results of three independent experiments with F1 B cells.

