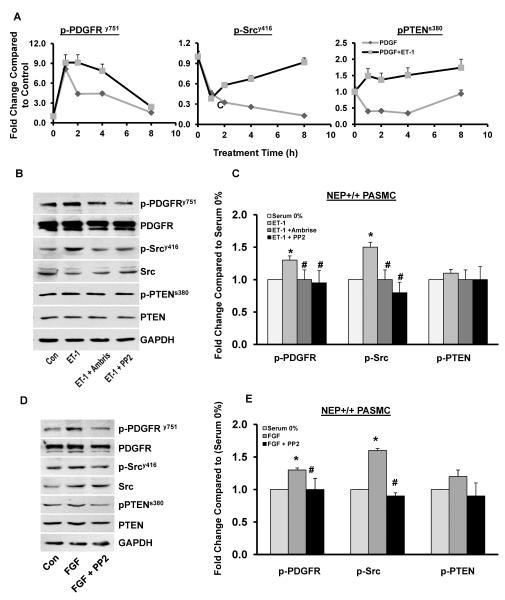
Figure 7. NEP substrates enhance PDGF signaling in NEP+/+ PASMCs.
NEP+/+ PASMCs were treated with PDGF in the presence or absence ET-1 for 1, 2, 4, and 8h and lysates were analyzed for levels of phospho and total PDGFR, Src and PTEN. Panel A shows graphical representation of change in p-PDGFR, p-Src and p-PTEN levels with time (n=3). NEP+/+ PASMCs were treated with ET-1 (10nM) for 8h in the presence or absence of Ambrisentan (10 μM) or PP2 (10μM) and lysates analyzed for levels of phospho and total PDGFR, Src and PTEN shown in Panel C. Panel D shows a graphical representation of effects of Ambrisentan and PP2 on the phospho levels from 3 different isolates. Panel E shows effect of PP2 (10μM) on FGF2 (10 ng/ml) induced levels of phospho and total PDGFR, Src and PTEN. Graphical representation from 3 different isolates is shown in Panel F. *p≤ 0.05 for comparisons of control to treated (n=3). # p≤ 0.05 for comparisons of ET-1/FGF ± inhibitor treatment.

