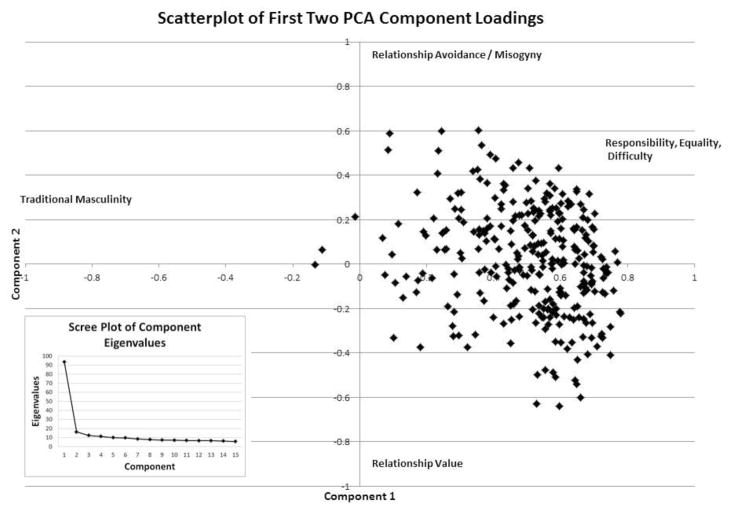
Figure 1.
Scatterplot of the component loadings of the first two PCA components. Each point on the plot represents the component loadings for one respondent. The horizontal axis represents the loadings for Component 1. The vertical axis represents component loadings for Component 2. Each component loading axis ranges from −1 to 1. Labels at the ends of each component indicate the interpretation of the extreme values of the component scores. The eigenvalues of each component is presented in a scree plot in the lower left hand corner of the plot. The scree plot shows a sharp drop in eigenvalue from the first to the second component.

