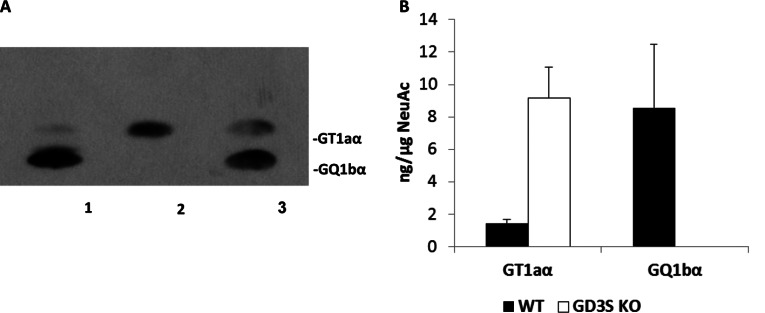
Figure 2. HPTLC-immunostaining analysis of the expression of Chol-1α antigens in the brains of WT and GD3S−/− mice.
Gangliosides were separated by HPTLC with the solvent system of chloroform/methanol/0.2% CaCl2 (50:45:10, by volume) and bands were visualized by immunostaining with anti-Chol-1α mAb (GGR-41) as described in the text (A). Each lane contained 3 μg of total lipid-bound sialic acid, and only the immunoreactive bands are shown. Lane 1, Gangliosides in the brain of WT mice; lane 2, gangliosides in the brain of GD3S knockout mice; lane 3, authentic GT1aα (20 ng) and GQ1bα (20 ng), respectively. (B) shows the concentrations of GT1aα and GQ1bα as determined by densitometric scanning of the intensities shown in (A). The y-axis represents ng (sialic acid) of the immunoreactive ganglioside in the total ganglioside fraction. The bar denotes S.E.M. of three independent determinations (n=3).

