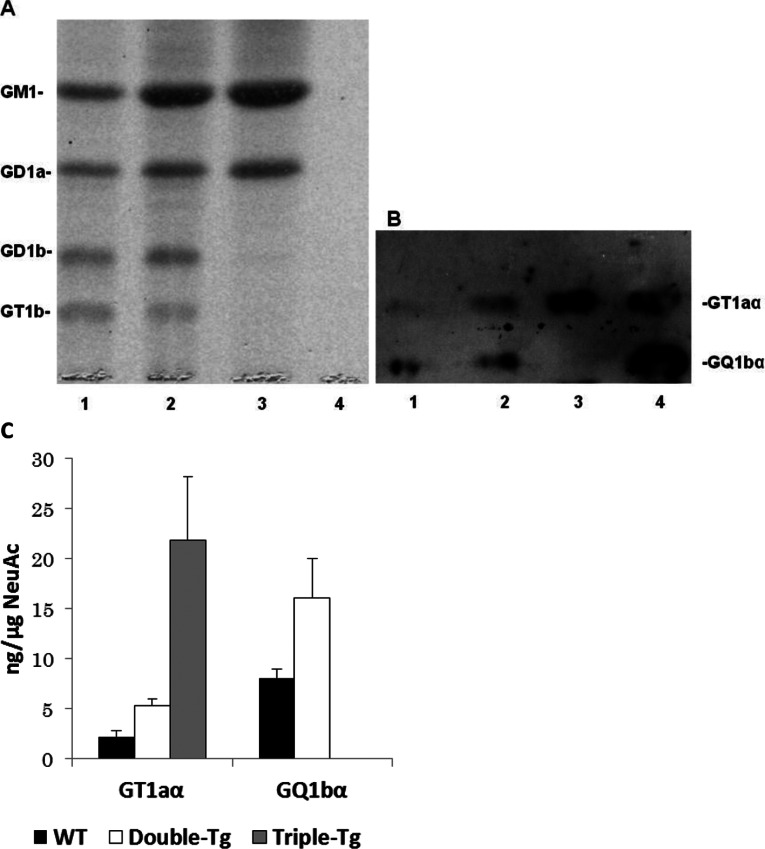
Figure 3. HPTLC analysis of ganglioside expression in the brains of double-mutant, triple-mutant and WT mice.
Gangliosides were separated by HPTLC using the solvent system of chloroform/methanol/0.2% CaCl2 (50:45:10, v/v) and bands were visualized by staining with the resorcinol-HCl reagent (A) or immunostaining with anti-Chol-1α mAb (GGR-41) (B). Each lane (1–3) contained 3 μg of lipid-bound sialic acid except lane 4. Lane 1, gangliosides of the brain of WT mice; lane 2, gangliosides of the brain of double-mutant mice; lane 3, gangliosides of the brain of triple-mtant mice; 4, authentic GT1aα (20 ng) and GQ1bα (20 ng), respectively. Please note that in lane 4, the amount of the two standards was too low to be revealed by the resorcinol-HCl reagent. (C) The concentrations of GT1aα and GQ1bα, present in the total gangliosides in each sample, were estimated by densitometric analysis of (B) (n=3). In triple-Tg mice, the concentration of GT1aα was significantly elevated compared with those in the WT and double-mutant mice. No detectable amounts of GQ1bα was present in the triple-mutant mouse brains.

