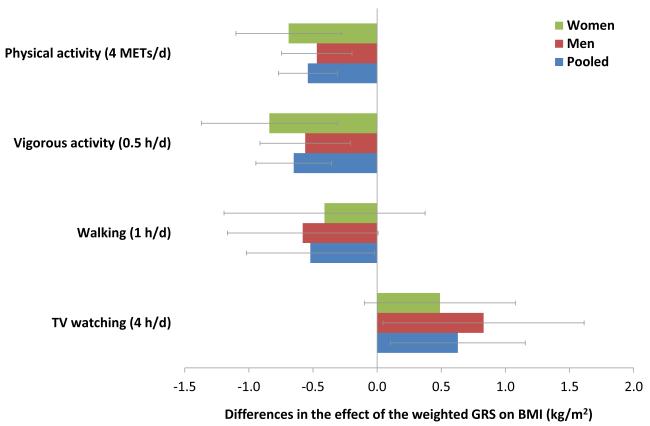
Figure 1. Differences in effect of the weighted GRS on BMI associated with physical activity and TV watching.
Data are based on the first 2 year of follow-up after the assessments of physical activity (1986-1988 in women and men) and TV watching (1992-1994 in women, 1988-1990 in men). Differences in genetic effect on BMI (beta [95% CI] for interaction) are reported for each additional 10 points of the weighted GRS associated with increased hours of total physical activity, vigorous activity, walking or TV watching, adjusted for age, genotype data source, disease status, smoking, alcohol intake, menopausal status (women only), total energy intake, vigorous activity (walking analysis only), walking (vigorous activity analysis only), and total physical activity (TV watching analysis only).

