
Figure 1.
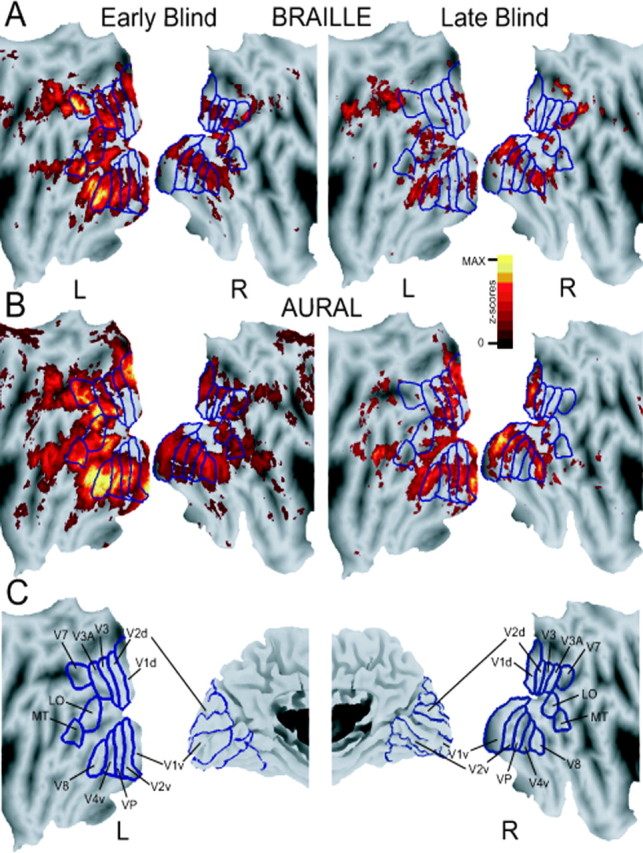
Two-dimensional, flattened views of z-score statistical parameter maps for visual cortex BOLD responses in early and late blind subjects. Maps in A and B were obtained, respectively, when subjects generated verbs to Braille read or heard nouns. A minimumz-score threshold for all maps was 4.5;p= 0.05. Maximumz-scores for results from early blind subjects were 30 and 35, respectively, in A and B, and 22 for all results from late blind subjects. C, Visuotopic borders drawn and labeled according to previous results obtained in sighted subjects (Hadjikhani et al., 1998; Van Essen, 2002, 2003).