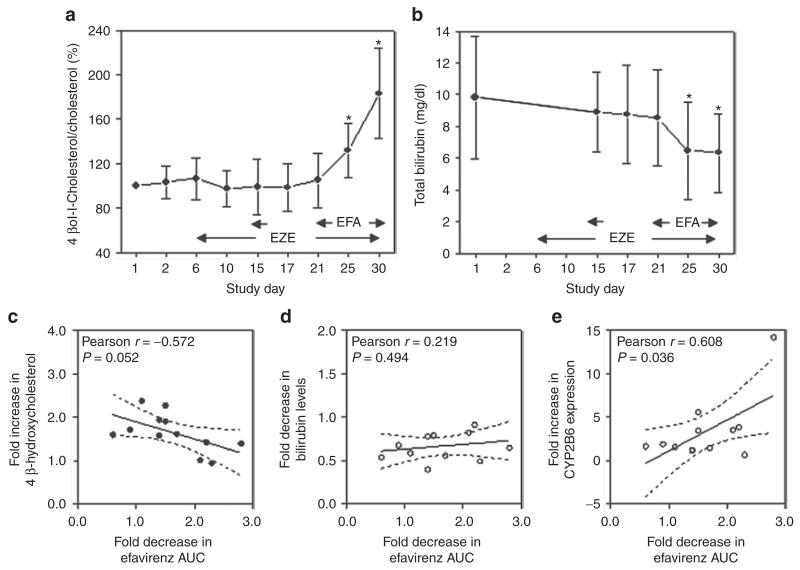
Figure 6.
Determination of endogenous markers of hepatic metabolism. (a,b) The ratio of 4β-hydroxycholesterol/cholesterol and the plasma bilirubin levels were determined at several time points. *P < 0.05, ANOVA, n = 12. The changes in (c) 4β-hydroxycholesterol and (d) total bilirubin levels and the change in (e) CYP2B6 expression in PBMCs were correlated with changes in efavirenz AUC assessed after a single dose and during steady state, respectively. Pearson regression; P value of F test. AUC, area under the curve; EFA, efavirenz; EZE, ezetimibe; PBMC, peripheral blood mononuclear cell.

