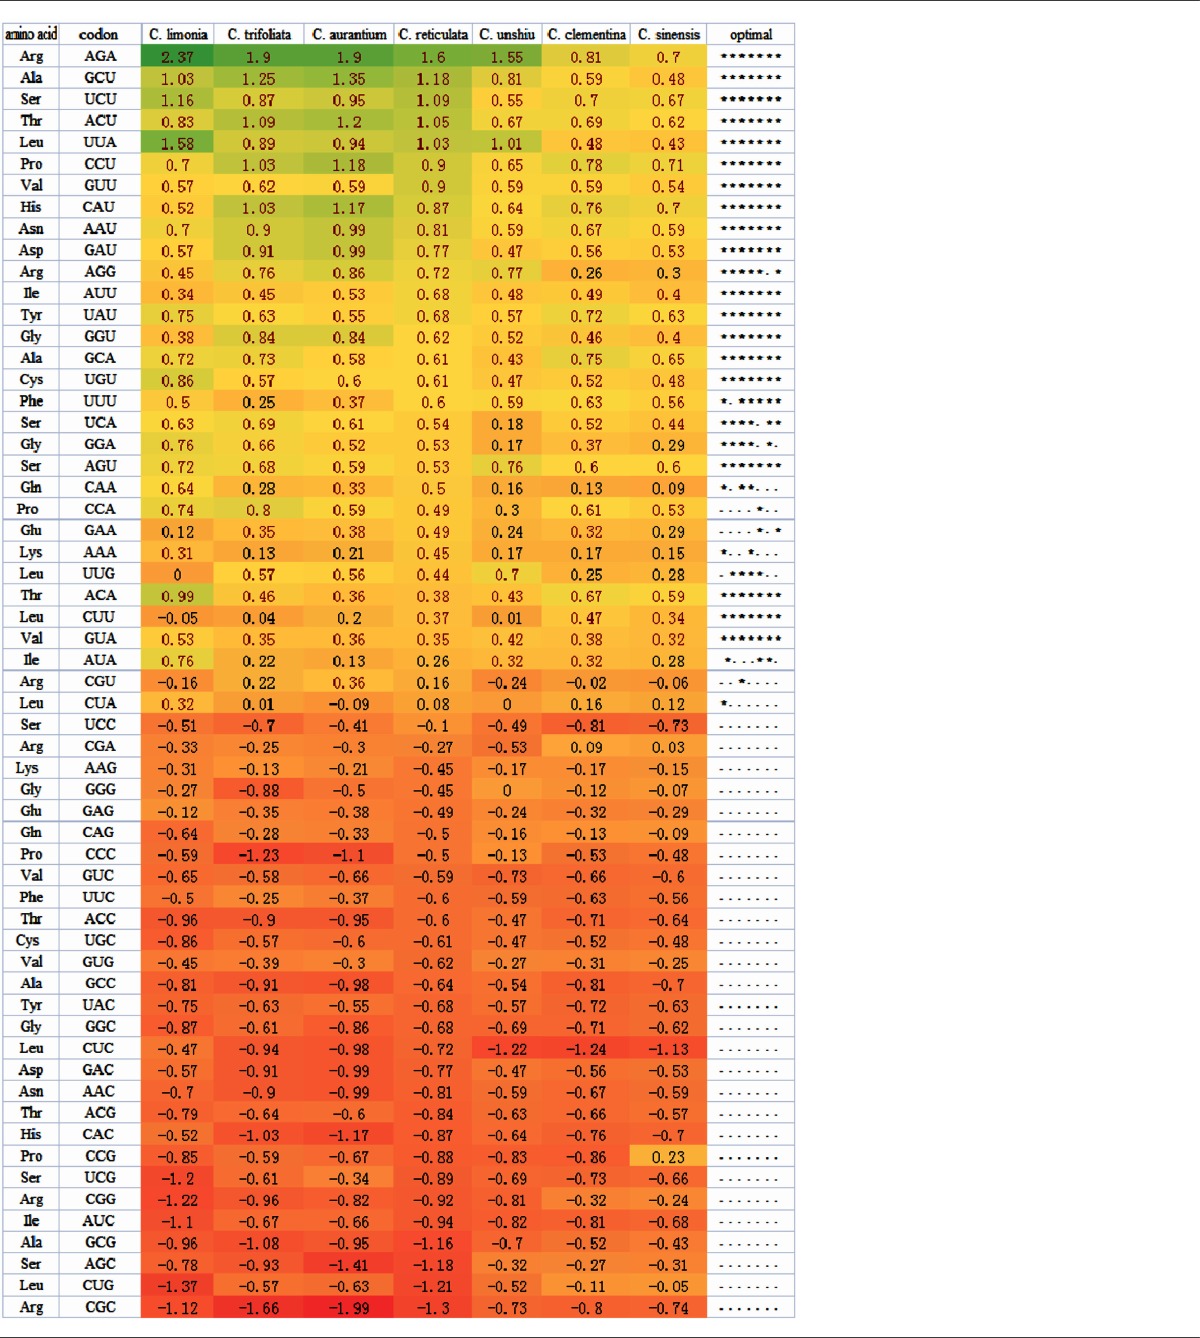
Table 1.
Differences in relative synonymous codon usage (RSCU) across codons between genes with high and low levels of expression.

Notes: The right-most column shows codons with significantly increased usage in highly expressed genes, as determined by a t-test (P < 0.05). Each * represents a species for which the t-test was significant, in the order as they are listed in the figure. Codons above the horizontal dotted lines were used to design the optimal codons and were used to calculate frequencies of optimal codon usage (FOP) in all species. The color in the figure indicates the gradient of ΔRSCU values, from the most positive (green) to the most negative (orange).
