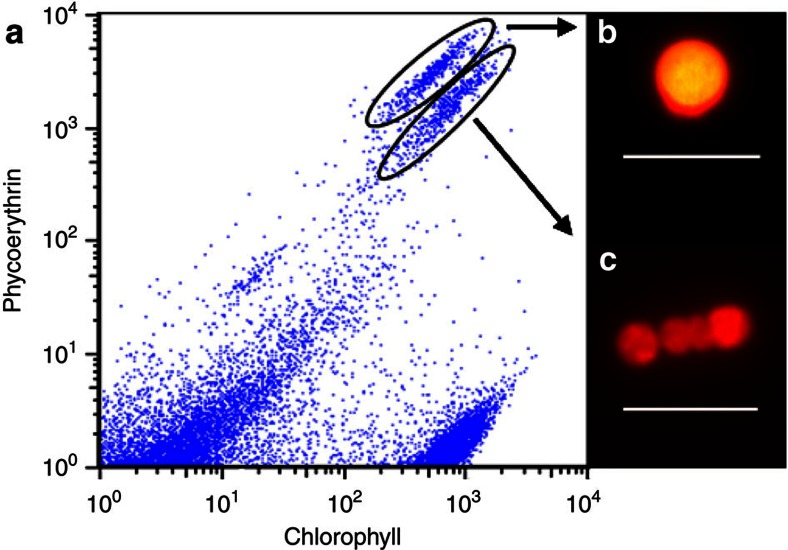
Figure 6. Flow cytometric analysis ofR. intracellularis–H. hauckii culture samples.
A cytogram displaying events gated based upon chlorophyll (692/40 nm) and phycoerythrin (572/27 nm) detection channels with the cyanobacteria symbiont populations easily separated (a). Insets are microscopy images under blue excitation of a vegetative trichome (b) and a heterocyst cell (c) representative of circled populations. Scale bars, 10 μm. The vegetative trichome population was sorted for genome sequencing samples.

