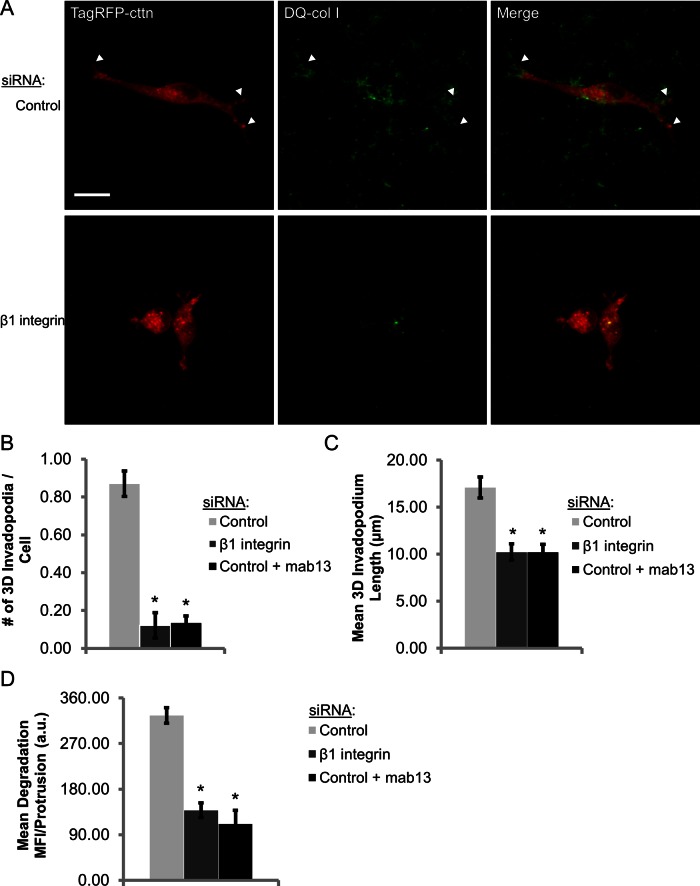
FIGURE 6:
β1 integrin promotes invadopodial matrix degradation in 3D extracellular matrix. (A–D) 3D extracellular matrix invadopodium assay. (A) Representative maximum-intensity Z‑projection multiphoton images of MDA-MB-231 cells transiently transfected with control or β1 integrin siRNA and TagRFP-cortactin. Cells were embedded in a 3D ECM gel consisting of type I collagen, DQ-type I collagen, and Matrigel for 36 h. (B) Quantification of invadopodium number in control, β1 integrin–depleted, and mab13-treated cells in 3D matrix. n > 115 cells; three independent experiments. *p < 1.27E-15, compared with control siRNA. (C) Quantification of invadopodium length in 3D matrix. n > 115 cells; three independent experiments. *p < 0.013, compared with control siRNA. (D) Quantification of mean DQ-collagen (degradation) MFI per protrusion > 7 μm. n > 115 cells; three independent experiments. *p < 3.15E-9, compared with control siRNA.

