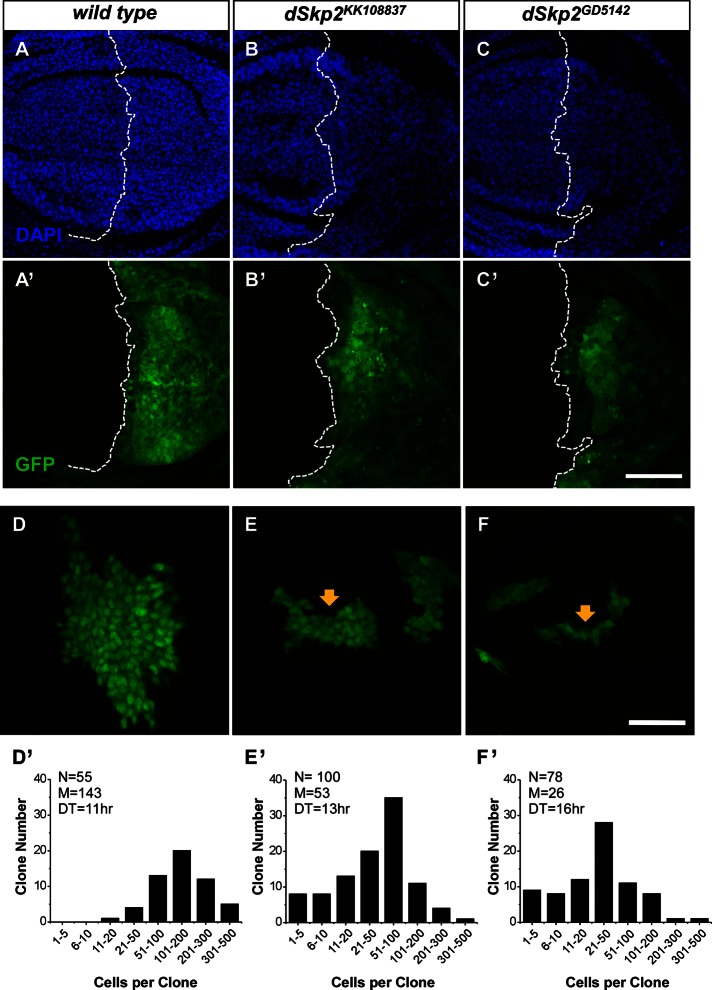
FIGURE 4:
Knockdown of dSkp2 slows cell proliferation in the wing discs. (A–C) DAPI staining of wing imaginal discs showing nuclear density differences in the posterior region of the disc with (B, C) or without (A) dSkp2 knockdown (driven by en-Gal4 in combination with UAS-dcr2 at 29°C). GFP signals mark the expression domain of en-Gal4 (B′, C′). (A′) The en-Gal4, UAS-GFP control. The genotypes are UAS-dcr2/+; en-Gal4, UAS-GFP/+ (A, A′), UAS-dcr2/+; en-Gal4, UAS-GFP/dSkp2KK108837 (B, B′), and UAS-dcr2/+; en-Gal4, UAS-GFP/+; dSkp2GD5142/+ (C, C′). Scale bar, 50 μm. (D–F) Cell division rate is decreased by dSkp2 knockdown (E, F), and GFP signals mark the RNAi-expressing clones (see the text for details), leading to smaller clones (arrows in E and F). In D, the GFP-marked cells are wild type. (D′–F′) Bar graphs showing the distribution of clones with different cell number per clone. N, number of total clones counted; M, median cell number per clone; DT, doubling time. The genotypes are y w, hs-flp/+; Act>y+>Gal4, UAS-GFP/+ (D and D’), y w, hs-flp/+; Act>y+>Gal4, UAS-GFP/dSkp2KK108837 (E, E′), and y w, hs-flp/+;Act>y+>Gal4, UAS-GFP/+; dSkp2GD5142/+ (F, F′). Scale bar, 25 μm.

