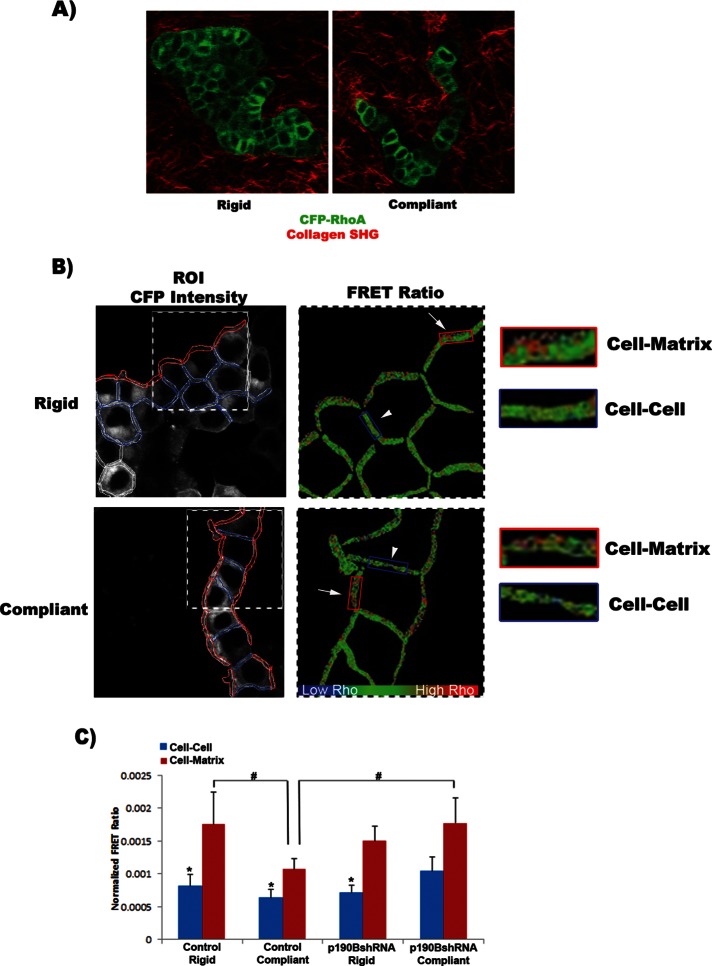
FIGURE 5:
RhoA activity is spatially regulated at cell–cell vs. cell–matrix attachments through a mechanism involving p190B. (A) T47D cells stably expressing a RhoA biosensor (RhoA-FLARE.sc) were cultured in floating or attached 1.3 mg/ml collagen gels (scale bar, 100 μm). Multiphoton microscopy was used to visualize CFP (green), and collagen was visualized by second harmonic generation (red). (B) The same cells were imaged by confocal microscopy to collect direct CFP emission (shown in a and b) and fretted YFP emission. The images were segmented into regions of cell–matrix and cell–cell interactions. Spatial RhoA activity was determined by ratiometric FRET analysis. (C) RhoA activity in control cells was determined to be significantly enhanced at sites of cell–matrix interactions compared with sites of cell–cell interactions. In addition, RhoA activity at the cell–matrix contact was significantly higher under rigid than under compliant conditions. In rigid conditions the loss of p190B resulted in a significant increase in RhoA activity at the cell–matrix contact, similar to that of controls. However, under compliant conditions the spatial regulation of RhoA activity was lost in p190B-knockdown cells, such that there is no longer a significant increase in RhoA activity at cell–matrix compared with cell–cell contacts. Of importance, comparing RhoA activity at cell–matrix ROIs, we find that knockdown of p190B significantly elevates RhoA activity at the matrix compared with control cells (*cell–cell vs. cell–matrix ROIs: control rigid, p = 0.038; control compliant, p = 0.005; p190BshRNA rigid, p = 0.003; #vs. compliant cell–matrix ROI: control rigid, p = 0.026; p190BshRNA compliant, p = 0.039; n = 9, three fields of cells from each of three independent experiments).

