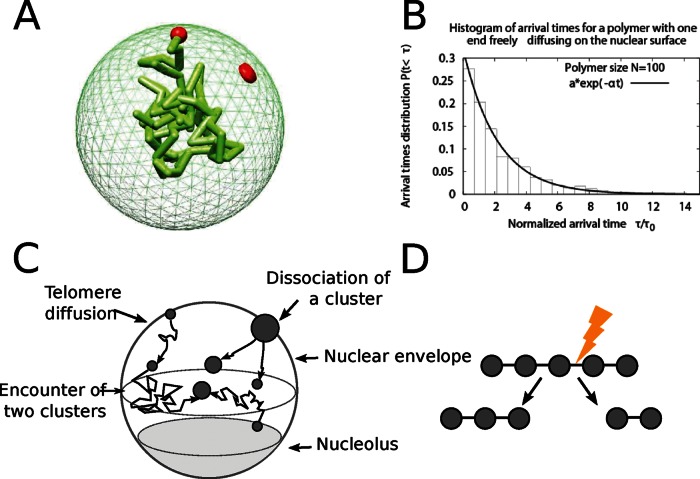
FIGURE 2:
Computational model of telomere cluster formation. (A) Snapshot from a Brownian dynamics simulation of a polymer with one end anchored on the nuclear surface. The polymer is composed of 100 monomers with average distance between monomers of l0 = 50 nm, and the nucleus is a reflecting sphere of size R = 250 nm. (B) Histogram of the arrival times for a polymer of size 100 monomers freely diffusing in the nucleus and one end constrained to the surface. A fit of the form f(t) = a exp(−bt) gives a = 1.014 and b = 0.76. (C) The diffusion–aggregation–dissociation model of telomere organization. Telomeres are represented as Brownian particles diffusing on the nuclear surface, and two telomeres coalesce with a rate kf and a cluster of n splits at a rate (n − 1)kb. (D) Schematic representation of the cluster dissociation model, in which a cluster of n telomeres has n − 1 bonds. Any of these bonds can break at a rate kb, and the cluster effective dissociation rate is (n − 1)kb.

