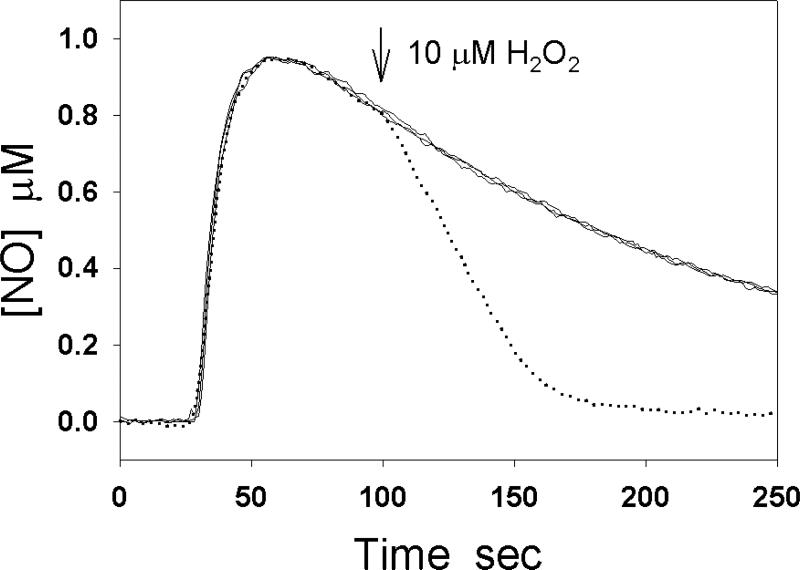
Fig. 8.
H2O2-induced NO consumption in the presence of Mb. The solid lines represent the NO decay curves after 1 μM NO was injected into the buffer solution, in the buffer solution containing 0.5 μM Mb, and in the buffer solution containing 10 μM H2O2. When 1 μM NO was injected into the solution in the presence of 0.5 μM Mb and the peak of the NO oxidation current was reached, the injection of 10 μM H2O2 greatly increased the rate of NO decay (dotted line).

