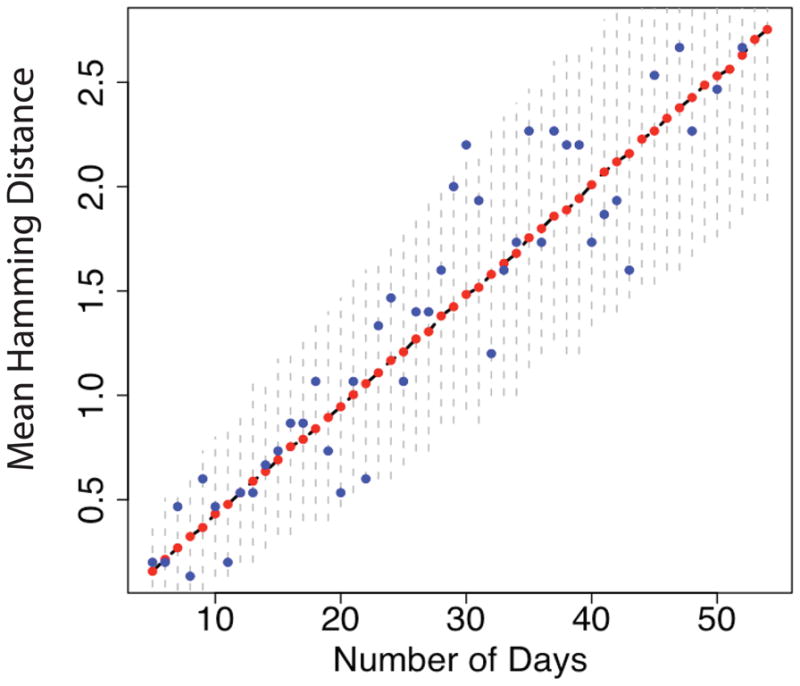
Figure 1.

We generated I(g, t) using the continuous, age-dependent model described in Section 1. Here NB = 2, 600 base pairs, α(a) = α0(a − Λ) for a > Λ, and β(a) = β0a. At each day we sampled N0 = 30 sequences, calculated the mean HD and then averaged over 10,000 runs. The blue dots shot the mean HD for one particular run, the red dots the average over all runs, and the black dashed line underneath shows the mean HD calculated from the theoretical framework. The vertical dashed lines are the 95% confidence intervals.
