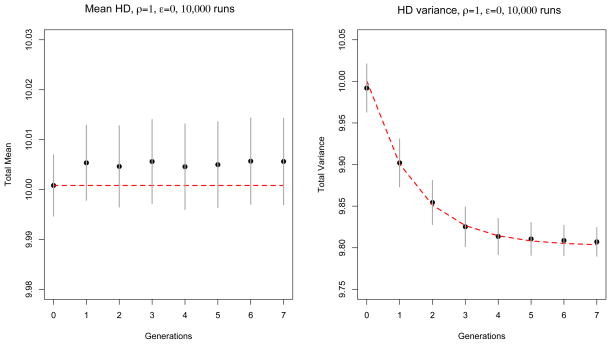
Figure 3.
Comparison between theory (red dashed line) and simulation (black dots) for an exponentially growing population with ρ = 1 and ε = 0 (recombination only). Mean and variance of HD are averaged over 10,000 runs. At generation g = 0 the initial population is made of 100 sequences with HD mean and variance λ0 = 10. Confidence intervals (±1.96 times the standard deviation over runs) are represented by vertical gray segments. Errors at different time points are positively correlated.

