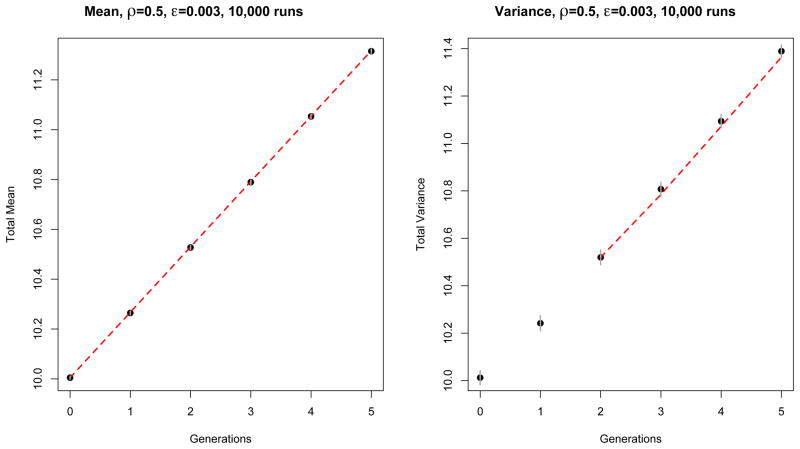
Figure 6.
Comparison between theory (red dashed line) and simulation (black dots) of the mean and variance HD0 for an exponentially growing population with ρ = 0.5 and ε = 0.003. The left panel represents the mean, and the right panel the variance, both averaged over 10,000 runs. Like before, at generation g = 0 the initial population is made of 100 sequences with HD mean and variance λ0 = 10. The simulation is represented by the black dots, and the theory by the dashed red line. Confidence intervals (±1.96 times the standard deviation over runs) are represented by vertical gray segments. In the right panel, the first few generations are omitted. The theory we developed neglects early stochastic events, which are of the order , where Ng is the population size at generation g. Hence, we find that only when the population size is large enough, do theory and simulation overlap.

