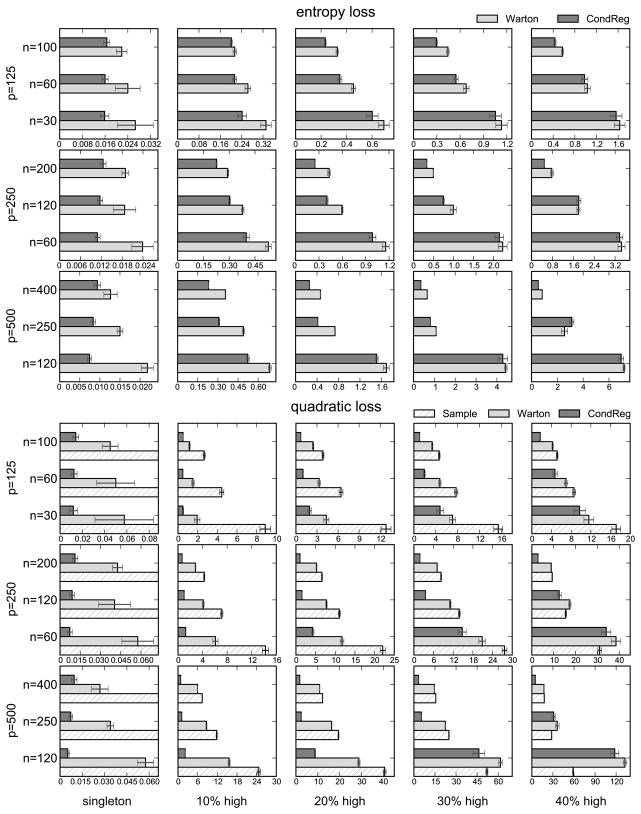
Figure 4.
Average risks (with error bars) over 1000 runs with respect to two loss functions when ρ= 0.1. sample=sample covariance matrix, Warton=linear shrinkage (Warton, 2008), CondReg=condition number regularization. Risks are normalized by the dimension (p).

