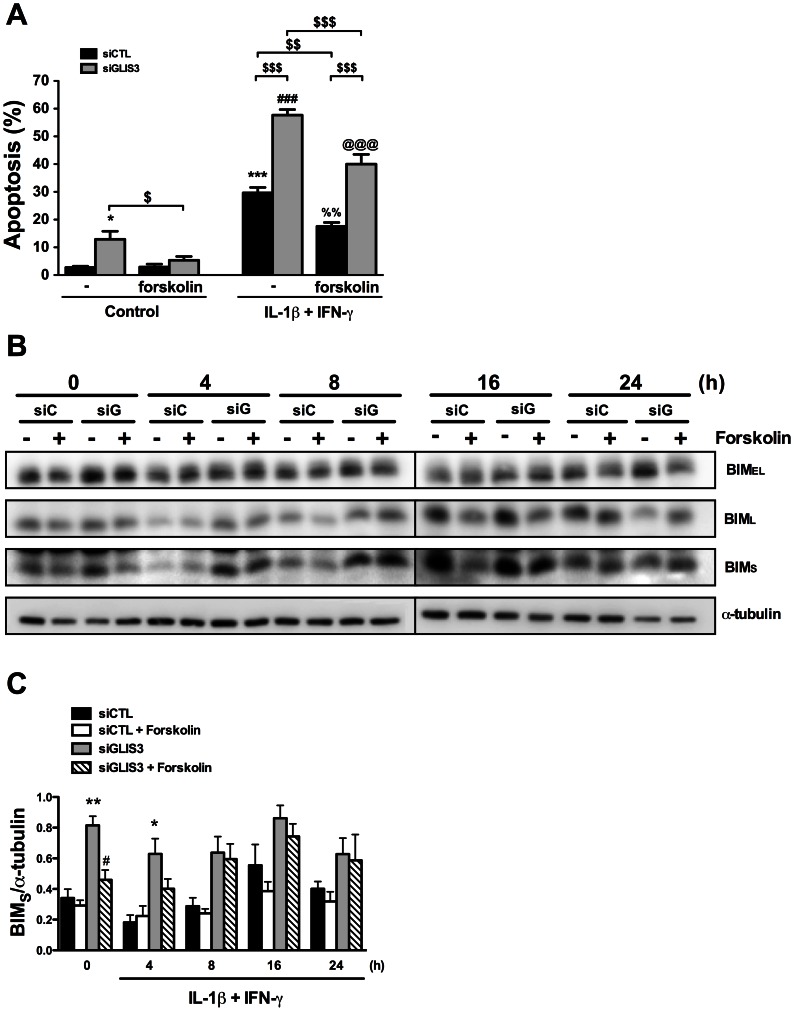
Figure 8. Forskolin partially prevents apoptosis following GLIS3 KD.
INS-1E cells transfected with control or GLIS3 siRNA were exposed to forskolin (20 µM) and/or cytokines for 24 h. After this period apoptosis was measured using nuclear dyes. (A) Apoptosis induced by cytokine treatment after siRNA transfection and forskolin exposure. Results are means ± SEM (n = 6) * P<0.05 or *** P<0.001 vs. siCTL without forskolin; ### P<0.001 vs. siGLIS3 without forskolin; %% P<0.01 vs. siCTL with forskolin; @@@ P<0.001 vs. siGLIS3 with forskolin; $ P<0.05, $$ P<0.01, $$$ P<0.001 as indicated by the bars. ANOVA followed by paired t-test with Bonferroni's correction; (B) Representative blot of BimEL, BimL and BimS protein isoform expression (n = 6); (C) Densitometry of BimS normalized by the housekeeping protein α-tubulin. Results are means ± SEM (n = 6) * P<0.05 or ** P<0.01 vs. siCTL, # P<0.05 vs. siGLIS3 by paired t-test.

