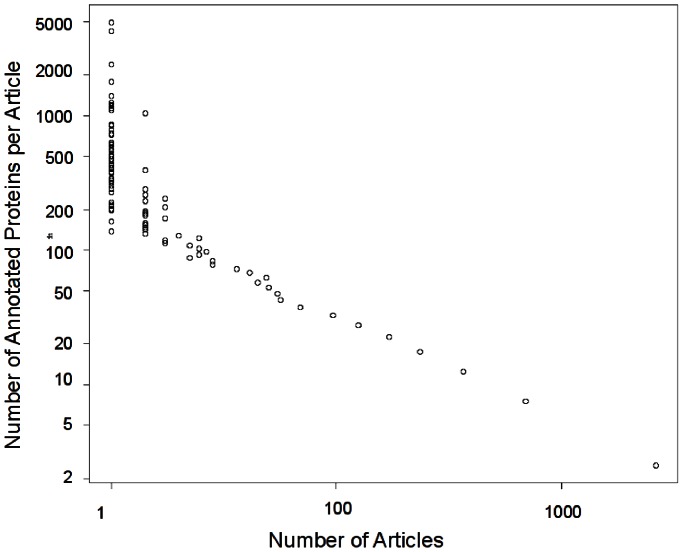
Figure 1. Distribution of the number of proteins annotated per article.
X-axis: number of annotating articles. Y-axis: number of annotated proteins. The distribution was found to be logarithmic with a significant ( ) linear fit to the log-log plot. The data came from 76137 articles annotating 256033 proteins with GO experimental evidence codes, in Uniprot-GOA 12/2011.

