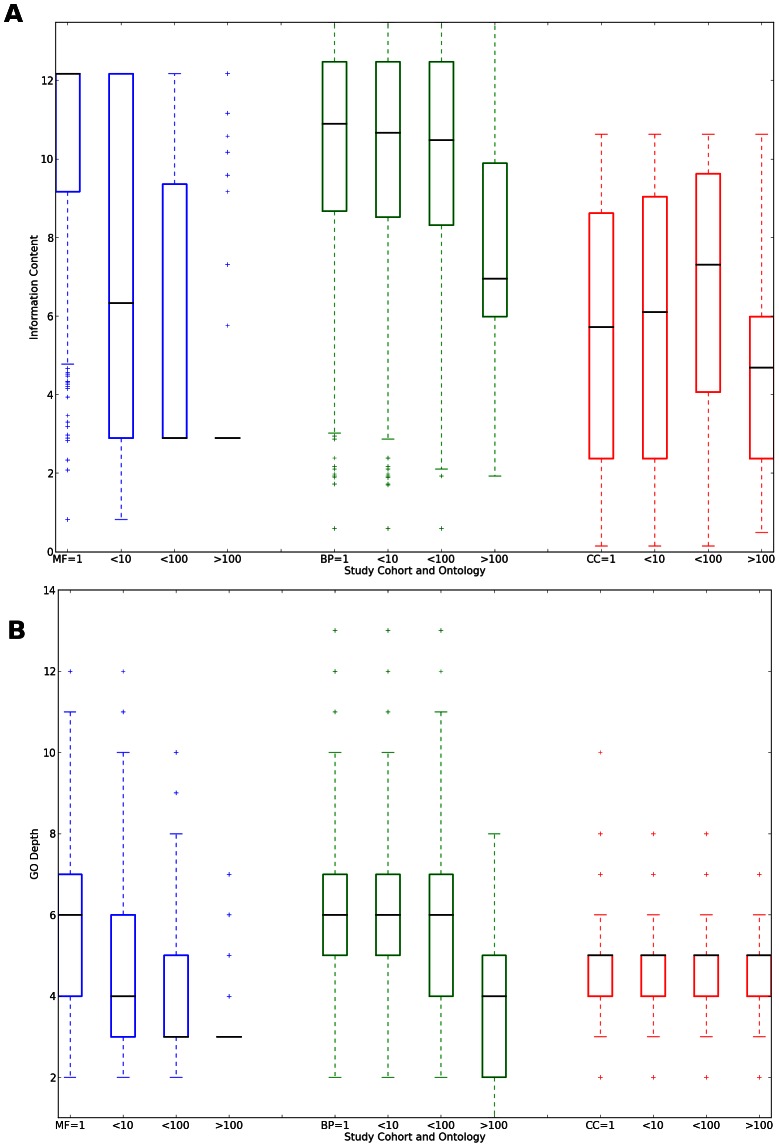
Figure 4. Information provided by articles depending on the number of proteins the articles annotate.
Articles are grouped into cohorts: 1: one protein annotated by article;  : more than 1, up to 10 annotated;
  : more than 10, less than 100 annotated;
  : 100 or more proteins annotated per article. Blue bars: Molecular Function ontology; Green bars: Biological Process ontology; Red bars: Cellular Component ontology. Information is gauged by A: Information Content and B: GO depth. See text for details.

