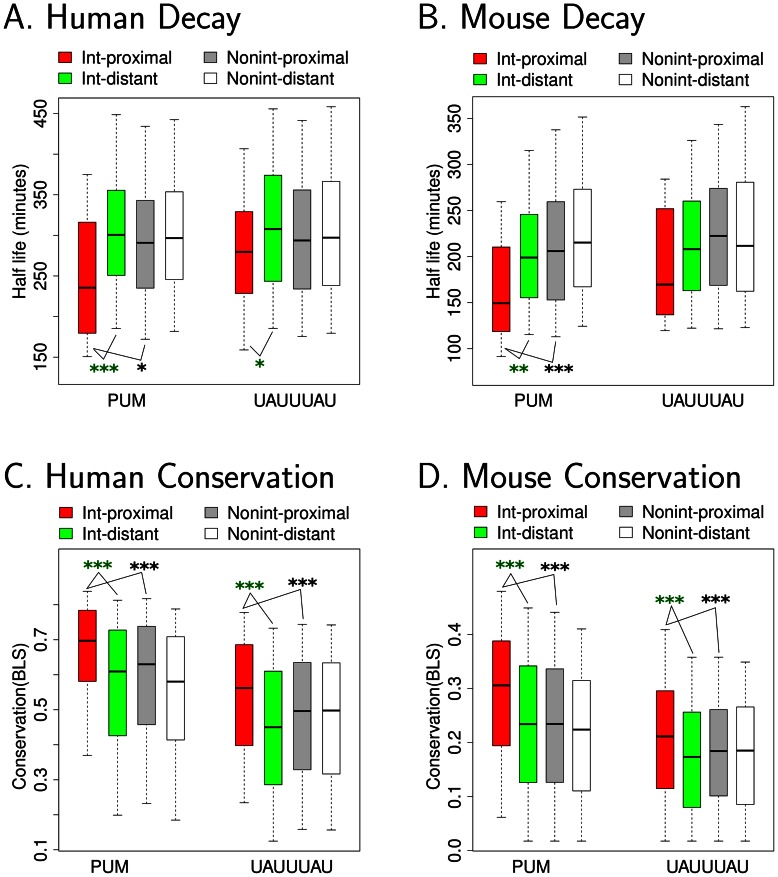
Figure 4. Pumilio recognition sites promote decay more effectively and are better conserved when present with interacting miRNAs.
Transcripts with a specific RBP recognition site were divided into four groups. Group “Int-proximal” contained transcripts with at least one RBP site and its interacting miRNA recognition site within 50 nts. Group “Int-distant” contained transcripts with both a RBP recognition site and a recognition site for its interacting miRNA, but no pair of RBP-miRNA site is within 50 nts. Group “Nonint-proximal” and “Nonint-distant” were similar to group “Int-proximal” or “Int-distant” except non-interacting miRNAs (not predicted in Figure 3) were analyzed. For each group of transcripts, the half lives (or conservation scores) were ranked and the (25%, 75%) range of the data were extracted and plotted with box-plots for visualization. The bottom and top of the box are the 25th and 75th percentiles (the inter-quartile range). Whiskers on the top and bottom represent the maximum and minimum data points within the range represented by 1.5 times the inter-quartile range. For each RBP, asterisks represent comparisons of half-life (or conservation score) between “Int-proximal” and “Nonint-proximal” or between “Int-proximal” and “Int-distant” by Wilcoxon test on the full range of data. One asterisk indicates p<0.05, two asterisks indicate p<0.01, and three asterisks indicate p<0.001. (A, B) Half-lives for mRNAs are plotted for human and mouse [58]. (C, D) Conservation BLS scores for RBP recognition sites are plotted.

