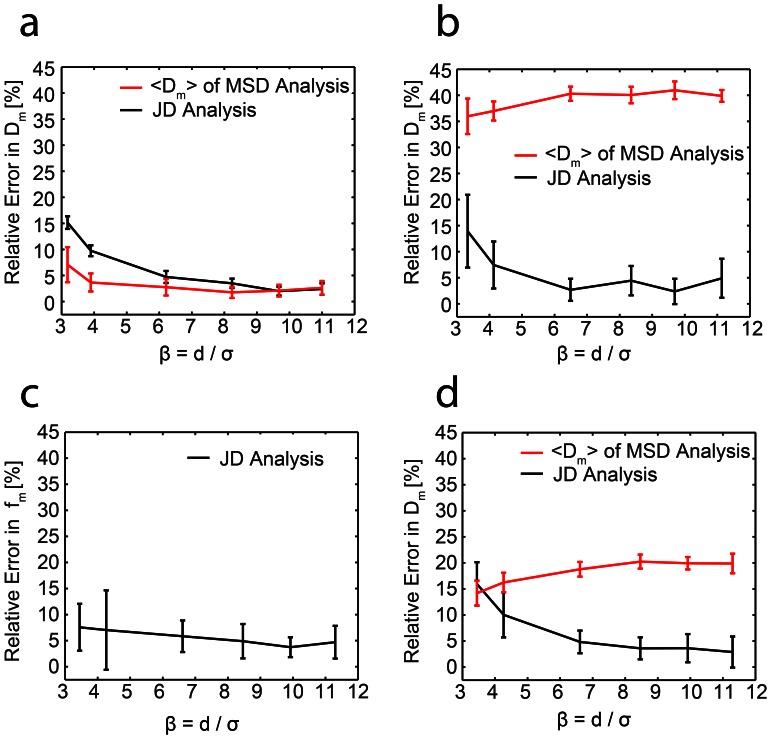
Figure 4. Comparison of JD analysis and MSD analysis on simulated data.
Simulations with varying mobile and immobile populations were used to compare the performance of the JD analysis (black curves) to the standard MSD approach (red curves). (a,b,d) The results shown are the relative error |Dm, (output)−Dm,(ground truth, GT)|/Dm (GT) in the diffusion coefficient of the mobile population as a function of the parameter β and (c) the relative error |fm (output)−fm(GT)|/fm (GT) in the mobile fraction as a function of the parameter β. All results are the mean values of 10 repetitions, with each repetition based on the analysis of 750 simulated trajectories. Error bars represent ±1 standard deviation (a) All particles belong to the mobile population. (b,c) 50% of the particles are mobile, and 50% immobile (d) 50% of particles undergo a motion change (mobile → immobile).

