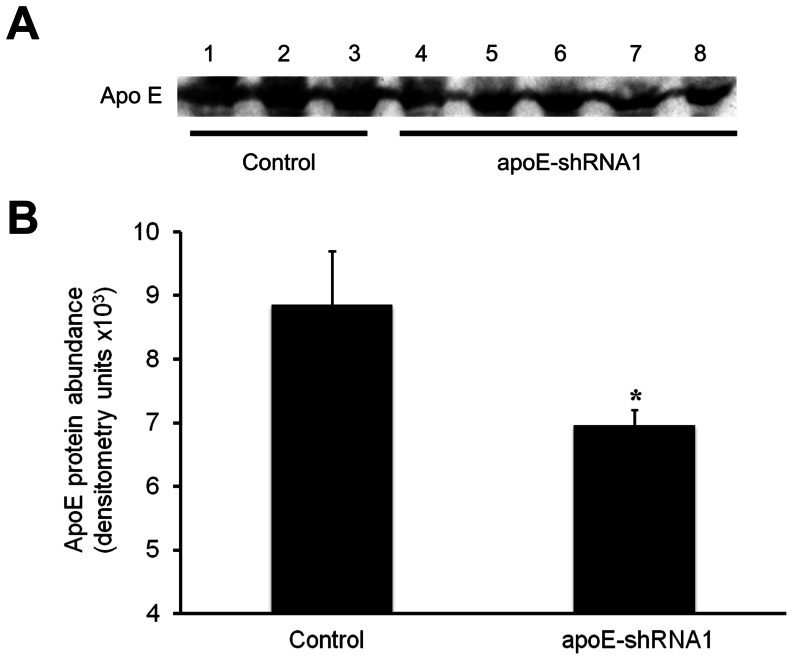
Figure 6. Detection of apoE in the plasma of control and transgenic (apoE-shRNA1) cloned pigs.
(A) Immunoblots showing the detection of apoE protein in plasma of control (lanes 1–3) and apoE-shRNA1 transgenic (lanes 4–8) cloned pigs. (B) The intensity (mean ± SEM) of the apoE bands in equal volumes of plasma samples was assessed by densitometric analysis. Mean band intensity between groups was compared by ANOVA. Mean band intensity between groups was compared by ANOVA (*P<0.05).

