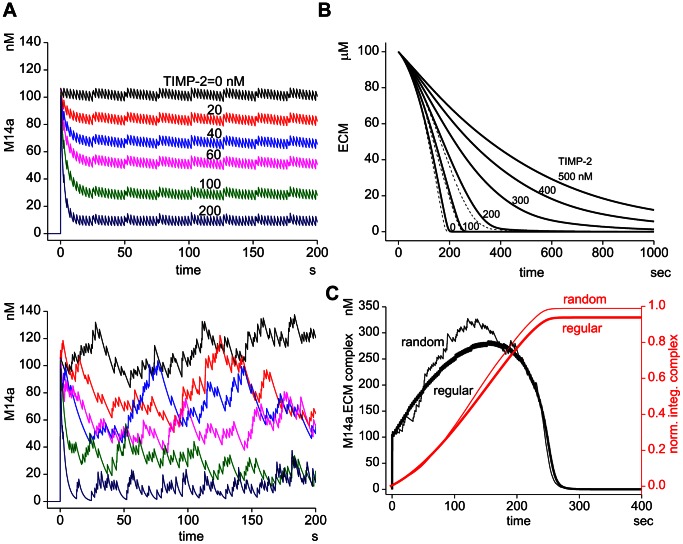
Figure 5. Pulsatile insertion of MT1-MMP.
(A) Time courses of M14a in the pulsatile insertion model of MT1-MMP. There are two different intervals in pulsatile insertion of MT1-MMP, which correspond to pools X and D. This results in the double zigzag lines with short (2.6 sec for pool D) and long (25.9 sec for pool X) intervals (top panel). If the intervals of the insertion of MT1-MMP in pools X and D are random instead of regular, M14a follows a considerably random time course (bottom panel). (B) Comparison of time courses for ECM degradation between regular (continuous lines) and random (broken lines) pulsatile insertion intervals. The differences in the time courses are small. (C) If we plot the time courses of complexes of active MT1-MMP and ECM (M14a.ECM) at TIMP-2 of 100 nM, its randomness in the random pulsatile insertion interval is much reduced in comparison to the time course of M14a (bottom panel in A). If the integrated values of M14a.ECM for regular and random pulsatile insertion, which is the direct measure of degraded ECM, are plotted, the curves resemble smooth lines for random pulsatile insertion (thin red line) and regular pulsatile insertion (thick red lines). There is only a small difference between the two.

