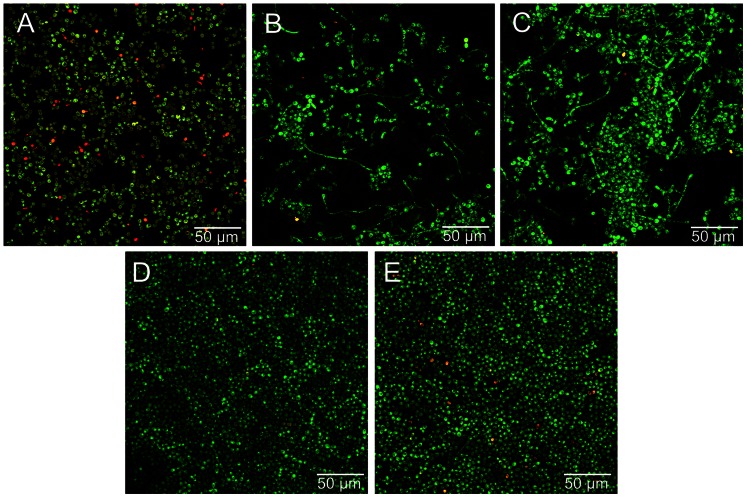
Figure 4. Representative confocal images of C. albicans biofilms (72 h) developed under exposure to dietary carbohydrates.
(A) Control, (B) starch, (C) starch+sucrose, (D) glucose, and (E) sucrose. Live cells appear green and dead cells appear red. A considerable number of hyphae forms can be observed in images B and C.

