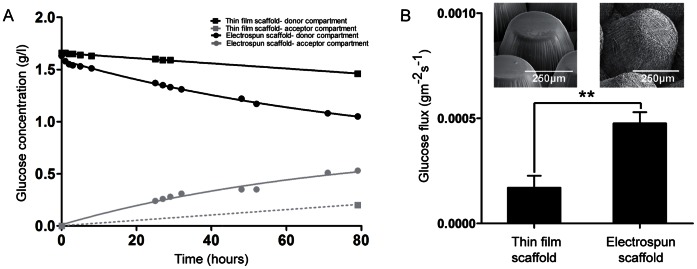
Figure 4. Glucose diffusion through microwell scaffolds.
(A)Typical glucose diffusion graphs for thin film and electrospun microwell scaffolds. For the thin film microwell scaffold, the concentration of glucose in the acceptor compartment is represented as a dashed line, because only the last time-point was within analytical range of the Vitros DT60 II chemistry system. (B) Maximum glucose flux through dense and electrospun microwell scaffolds. Data represents mean ± SD (n = 3), **p<0.01.

