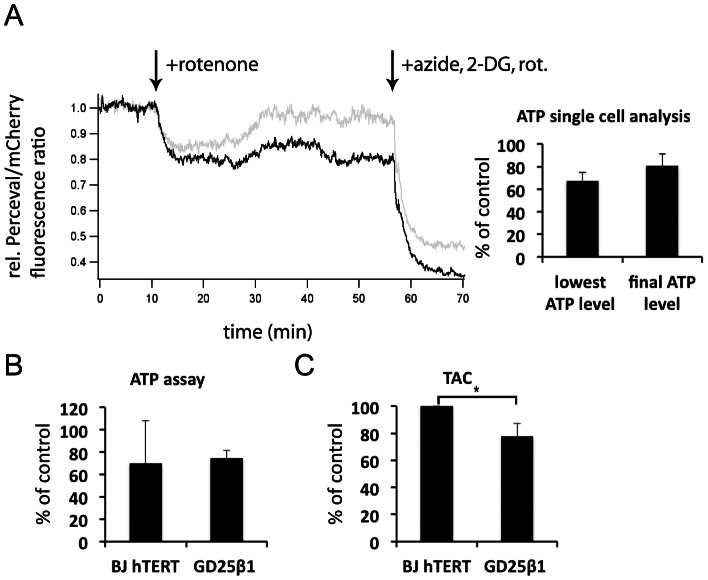
Figure 5. Measurements of intracellular ATP and antioxidant capacity.
(A) Confocal microscopy recordings of ATP in single cells. GD25β1 cells were transfected with Perceval and prepared as described in Material and Methods. The traces are representative recordings of two cells. The addition of 1 µM rotenone and the subsequent treatment with a combination of rotenone, sodium azide and the glycolysis inhibitor 2-deoxy-D-glucose (2-DG) to maximally reduce ATP levels are indicated by the arrows. Quantifications from 8 cells are shown to the right. The bars show means of the lowest ATP level during treatment with rotenone alone and the ATP level just before addition of the inhibitor combination. (B) ATP levels of serum-starved BJ hTERT and GD25β1 cells after 45 min treatment with rotenone as determined by a colorimetric ATP assay performed described in Materials and Methods. n = 2. (C) Total antioxidant capacity (TAC) of serum-starved BJ hTERT and GD25β1 cells as determined by a colorimetric TAC assay described in Materials and Methods. The results are expressed as Trolox equivalents and were normalized to BJ hTERT cells in order to be able to compare the two cell lines with each other. n = 3. All error bars in Fig. 5 represent standard deviation, * p<0.05.

