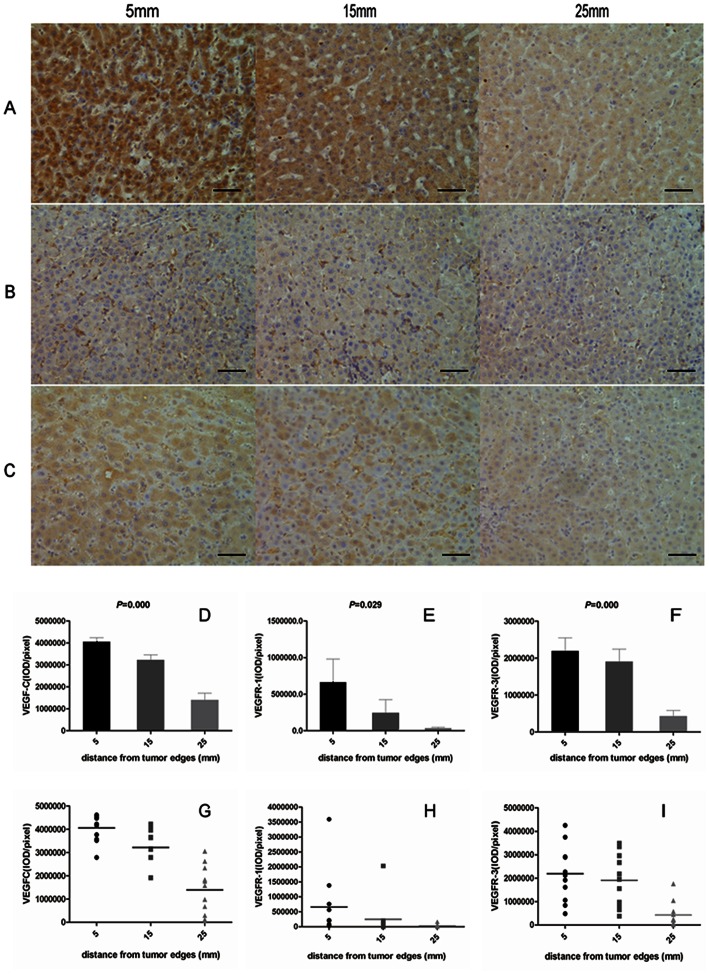
Figure 3. VEGF-C, VEGFR-1, and VEGFR-3 Distribution in Peritumoral Liver Tissue.
Representative distant peritumoral liver sections of VEGF-C (A), VEGFR-1 (B), and VEGFR-3 (C) staining. All three factors decreased with distance from the tumor edge. D–F showed an obviously down-regulation of all three factors along the tumor marginal distances for VEGF-C (D), VEGFR-1 (E), and VEGFR-3 (F), respectively. Peritumoral expression of the three factors differed in 35 patients for VEGF-C (G), VEGFR-1 (H), and VEGFR-3 (I). Black bars, 50 um.

